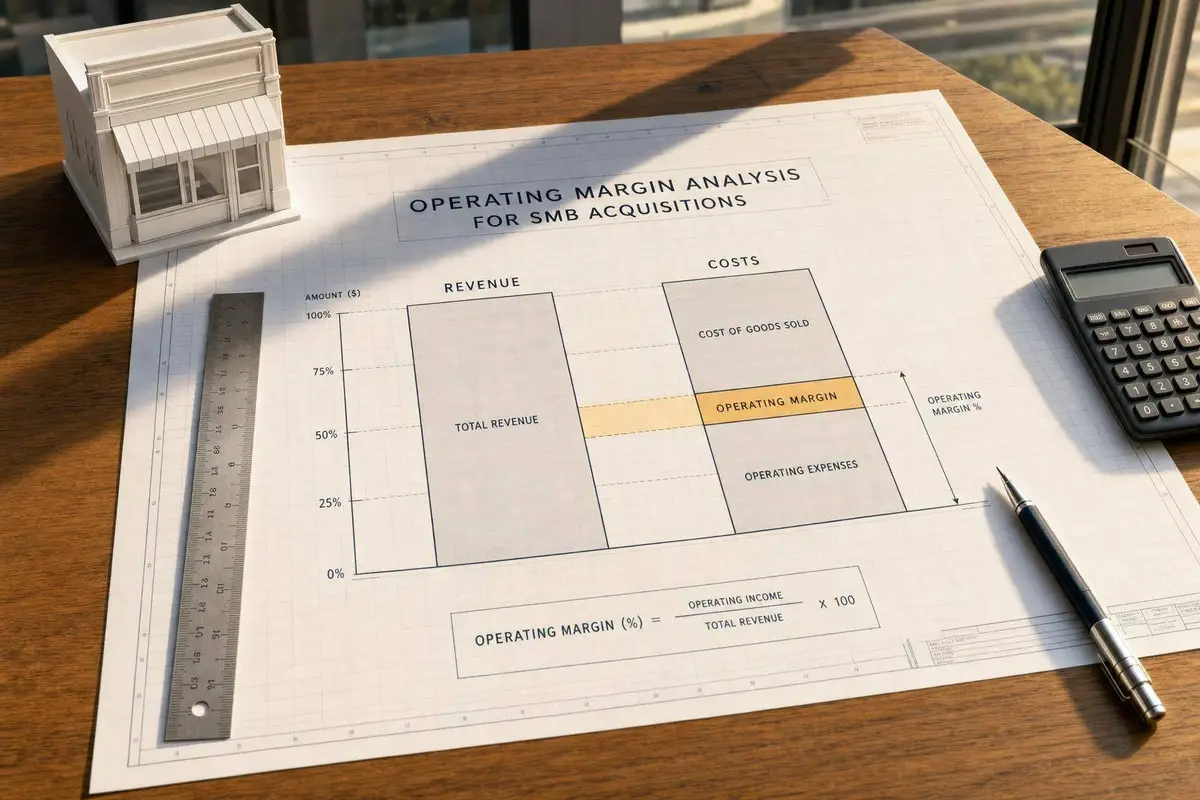
Operating Margin Analysis for SMB Acquisitions
Rebuild and normalize operating margins for SMB deals to assess valuation, debt capacity, and lender risk.
 Samson JagorasPrincipal & CEO/CIOSeptember 27, 2026
Get matched with the right lender for your business
Compare offers from our vetted network. Pre-qualify in minutes — no impact to your credit.
If I’m buying a small business, I care less about revenue and more about what the business keeps. A company with a 10% margin and one with a 20% margin can look similar on the surface, but the deal can work very differently once debt, owner pay, and a rough first year are factored in.
Here’s the short version:
- Operating margin = operating income ÷ revenue
- It shows how much profit is left after core business costs, before interest and taxes
- Buyers compare it with gross margin, EBITDA margin, net margin, and SDE
- I’d want to rebuild the number from source records, not rely on a broker summary
- I’d also check 3–5 years plus TTM, not just one clean year
- Add-backs only count if they are owner-specific, one-time, and documented
- Lenders turn margin into DSCR, and many SBA loans need about 1.25x
- A 10%–20% revenue drop test can change loan size, price, and deal terms , especially when using SBA 7(a) loans for the acquisition.
A few numbers from the article make the point fast. In one example, a business with $1,250,000 in revenue had a 12.4% operating margin. In another, reported operating income of $240,000 on $3,000,000 of revenue became $560,000 of normalized EBITDA after supportable add-backs, moving margin from 8.0% to 18.7%. That kind of shift can change both value and debt capacity.
| Metric | What I use it for |
|---|---|
| Gross margin | Check pricing and direct cost control |
| Operating margin | Check the full cost base before financing |
| EBITDA margin | Check earning power and lender fit |
| Net margin | Cross-check after interest and taxes |
| SDE margin | Check owner benefit in smaller owner-run deals |
The main takeaway is simple: margin quality drives price, loan support, and close risk. If margins are steady, documented, and hold up under stress, the deal has a much better chance of working.
How to Analyze SMB Deals Like an M&A Pro: Identify BAD DEALS in 5 Minutes Flat

sbb-itb-a3ef7c1
Operating margin formulas and the earnings metrics buyers compare

SMB Acquisition Margin Metrics: What Each One Tells Buyers
How to calculate operating margin from the income statement
In diligence, buyers usually start with one simple test: Operating Margin = Operating Income ÷ Revenue.
Operating income is what’s left after revenue covers COGS and operating expenses like payroll, rent, marketing, and insurance. On paper, that sounds simple. In practice, buyers don’t just take the P&L at face value.
They rebuild the figure from tax returns, the P&L, and the general ledger to spot misclassifications and owner-related costs. Then they line it up against gross margin, EBITDA margin, net margin, and SDE to see where profit is leaking out.
Here’s a plain example. Say an SMB reports FY2025 revenue of $1,250,000, COGS of $475,000, and operating expenses of $620,000. That leaves operating income of $155,000 and an operating margin of 12.4%. In plain English, the business keeps 12.4 cents of each revenue dollar after paying its core operating costs.
During that review, buyers pay close attention to outlier categories and owner-related items.
Operating margin vs. gross margin, EBITDA margin, net margin, and SDE
Each margin tells a different part of the story. Buyers compare them to judge not just profit, but whether that profit can carry debt and how it compares to SBA 7(a) loan terms vs. other financing options and hold up after the owner exits.
Gross margin is gross profit ÷ revenue. It shows unit economics before overhead gets involved. If gross margin looks strong but operating margin looks weak, overhead is likely eating too much of the profit.
Operating margin brings overhead into the picture. It’s a better test of whether the business can carry its full cost structure, not just production but admin too.
EBITDA margin is EBITDA ÷ revenue. It removes depreciation and amortization, along with interest and taxes. Buyers and lenders often use it to compare earning power across SMBs and to judge debt capacity. For example, $1,250,000 in revenue and $190,000 of EBITDA works out to a 15.2% EBITDA margin.
Net margin is net income ÷ revenue. This is the bottom line after interest, taxes, and non-operating items. Buyers mostly use it as a cross-check because it can swing based on leverage and tax planning, not just day-to-day operations.
SDE (Seller's Discretionary Earnings) is the main earnings measure for smaller, owner-run businesses. It adds back the owner’s compensation, personal and discretionary expenses, and non-recurring items to net income. The goal is to show the total economic benefit available to that owner. As deal size goes up and management becomes more professionalized, buyers and lenders lean more on EBITDA and operating margin to judge scale and debt capacity. This assessment is critical when exploring acquisition financing and the SBA to fund the deal.
| Metric | Formula | What It Captures | Primary Use in SMB Deals |
|---|---|---|---|
| Gross Margin | (Revenue – COGS) ÷ Revenue | Production and pricing efficiency | Early screen for unit economics |
| Operating Margin | Operating Income ÷ Revenue | Core profitability before financing/taxes | Operational health and cost structure |
| EBITDA Margin | EBITDA ÷ Revenue | Earnings before non-cash and financing items | Lender underwriting and valuation multiples |
| Net Margin | Net Income ÷ Revenue | Bottom line after all obligations | Cross-check on tax and financing choices |
| SDE Margin | SDE ÷ Revenue | Total owner benefit in small, owner-run businesses | Valuation of Main Street, owner-operated deals |
The goal here is to separate pricing power, overhead burden, and financing capacity. One clean year can look great and still mislead. Multi-year margins give buyers a much better read on whether the business is improving or just getting a short-term lift from timing.
A multi-year margin comparison table
Trend matters more than one clean year.
| Margin Type | FY2024 | FY2025 | TTM 9/1/2026 |
|---|---|---|---|
| Revenue | $1,100,000 | $1,200,000 | $1,250,000 |
| Net Income Margin | 6.5% | 7.2% | 7.5% |
| Operating Margin | 10.2% | 11.5% | 12.4% |
| EBITDA Margin | 12.0% | 13.1% | 14.2% |
| Adjusted EBITDA Margin | 14.5% | 15.0% | 15.8% |
Adjusted EBITDA margin is usually higher because it includes add-backs.
Next, separate defensible add-backs from expenses that belong in normalized earnings.
Normalizing earnings: owner add-backs and what buyers accept
Normalization removes owner-specific and one-off items so buyers can see what the business earns under professional management. After that, the next step is simple: test which adjustments will hold up when navigating loan qualifications.
Common owner add-backs in small business acquisitions
Common add-backs include:
- Excess owner salary - The owner pays themselves $300,000, but a qualified GM would cost $180,000. That $120,000 difference is the add-back.
- Personal expenses - Vehicle leases, family travel, and club dues booked as business costs. If a company reports $80,000 in travel and auto expense, about $50,000 of that may be personal spending.
- Above-market related-party costs - The owner charges the business $180,000 in rent, while market comps point to $130,000. That $50,000 gap can be added back if the market support is there.
- Nonrecurring legal or consulting fees - Think a lawsuit settlement or a one-time systems setup. A business showing a 5% operating margin may normalize to 10–12% after backing out a $100,000 litigation expense, assuming the file supports it.
Defensible vs. aggressive add-backs
Buyers don't accept add-backs just because management says they should. The adjustment needs to be nonrecurring, owner-specific, and backed by records.
Defensible add-backs clear all three tests. A one-time roof replacement with contractor invoices, a litigation settlement with law firm billing records, or a personal vehicle lease backed by registration documents usually stands up in underwriting.
Aggressive add-backs tend to fall apart because they miss at least one of those tests. The clearest red flag is when a so-called one-time expense shows up again and again. If a $60,000 consulting fee appears in FY2023, FY2024, and FY2025, lenders will usually treat it as recurring and remove the add-back. The same goes for forward-looking changes. If the pitch is, “we’ll renegotiate this supplier contract after close,” that's a synergy, not historical normalization, so it rarely gets credit in debt service calculations.
Lenders often look harder when total add-backs go above about 20% of base EBITDA, and deals where buyer-adjusted EBITDA is more than 15% above lender-normalized EBITDA often get pushed to credit committee review. In practice, the paperwork decides the outcome. Payroll registers, credit card statements, lease comps, and legal invoices are what move an adjustment from nice story to usable cash flow.
A normalized earnings bridge table
The bridge below shows how reported earnings turn into lender-ready earnings for the HVAC business example, using $3,000,000 in annual revenue.
| Line Item | Adjustment (USD) | Rationale | Documentation Status | Margin Impact |
|---|---|---|---|---|
| Reported operating income | $240,000 | As stated on income statement | Income statement | 8.0% |
| + D&A | +$60,000 | Non-cash depreciation and amortization | Fixed asset schedule | +2.0% |
| + Excess owner salary | +$120,000 | Owner paid $300K; market GM costs $180K | Payroll records, market salary benchmarks | +4.0% |
| + Personal auto & travel | +$50,000 | Personal vehicle and family travel in business accounts | Credit card statements, GL detail | +1.7% |
| + Above-market related-party rent | +$50,000 | Business pays $180K; market comps show $130K | Lease agreement, broker rent comps | +1.7% |
| + One-time legal fees | +$40,000 | Lawsuit settlement; fully resolved, non-recurring | Law firm invoices, settlement agreement | +1.3% |
| Normalized EBITDA | $560,000 | 18.7% |
That jump in margin changes both valuation and debt capacity, but only if the support holds up in underwriting. Once normalized earnings are in place, the next question is whether that margin stays intact across multiple years and across the cost base.
Margin trends, fixed vs. variable costs, and operating leverage
How to review margin trends across multiple years and TTM
Buyers don't just look at a margin number and call it a day. They check whether normalized margins hold up across 3–5 years and TTM. And the path of those margins matters just as much as where they sit today.
A company with a slightly lower margin right now, but a steady three-year climb, can be a better target than a company posting a higher current margin that has been slipping for the past two years. That pattern says a lot. It can point to pricing discipline and tight cost control. Or, on the other side, it can show a business that's slowly giving up ground.
TTM rolls the most recent 12 months forward each month. So if TTM starts to pull away from the prior full-year result, buyers want a clear reason on paper. Maybe wages went up. Maybe a customer left. Maybe pricing changed. Maybe new overhead hit the P&L. If the cause is a one-time event and the file backs it up, buyers may treat it as a short-term variance. If it looks like a lasting shift in the margin profile, they'll underwrite it that way.
That trend review leads straight into the next issue: what kind of cost structure is sitting underneath the margin.
Fixed costs, variable costs, and contribution margin
Fixed costs - like rent, salaried admin payroll, insurance, and core software subscriptions - stay in place whether revenue moves or not. Variable costs - like direct labor on hourly or piece-rate plans, raw materials, subcontractor fees, and payment processing fees - rise and fall with production volume. In many SMBs, expenses sit somewhere in the middle. They're mixed. Owner compensation is a common example because buyers often swap it out for a market-rate manager salary.
Contribution margin is revenue minus variable costs, shown as a percentage of revenue. If that margin is high, more of each extra $1 of sales goes toward covering fixed costs and then drops into operating profit. If it's low, variable costs eat up most of each new sale, so profit grows more slowly even when revenue is moving up.
Buyers use contribution margin to pressure-test the business. If revenue falls, variable costs should fall with it. Fixed costs usually don't. So the key question is simple: after that drop, is there still enough contribution margin left to cover the fixed cost base and service debt?
A business with a heavy fixed-cost base can have more upside, but it also carries more downside. A business with more variable costs is easier to reset when sales soften, though it often scales at a slower pace. Buyers weigh that tradeoff against debt service and the plan after closing.
A cost-structure classification table
Margin by itself doesn't tell the full story. Buyers need to know which costs move with revenue and which stay put. That's what shapes operating leverage. The table below lays out common SMB expense categories and shows how each one can affect upside, downside, and scale.
| Expense Category | Classification | Leverage Effect | Downside Risk | Scale Behavior |
|---|---|---|---|---|
| Rent & utilities | Mostly fixed | Raises break-even; amplifies profit upside above it | High - costs don't fall if revenue drops | Limited until capacity expands |
| Admin payroll | Mostly fixed | Creates a sticky overhead floor | High - difficult to cut quickly | Moderate; headcount adds in steps |
| Direct labor (hourly / piece-rate) | Mostly variable | Low leverage; costs scale with revenue | Low - hours flex down with demand | Strong; labor adjusts to workload |
| Salaried direct labor | Mixed | Often treated as fixed in the short term to retain staff | Moderate - harder to reduce quickly | Limited without adding headcount |
| Materials & direct COGS | Mostly variable | Low leverage; protects margins in downturns | Low - scales down with volume | Strong; cost moves with output |
| Software / SaaS subscriptions | Mostly fixed | Low marginal cost to grow within current tier | Moderate - constant drain in slow months | Good up to usage thresholds |
| Marketing / ad spend | Mixed | Discretionary; can be cut to preserve cash | Low-moderate - but cuts may reduce revenue | Flexible; tied to campaign decisions |
| Owner compensation | Fixed (replacement salary) | Must be replaced with a market-rate manager salary | High if underfunded post-close | Neutral once properly normalized |
That margin profile helps drive two big things: how much value the market puts on the business, and how much debt the company can carry.
How margin quality shapes valuation, debt capacity, and lender fit
Why stable margins support stronger valuation and deal structure
Once the cost base is clear, margin quality turns into a valuation and financing issue. In plain English, buyers want to know whether earnings hold up after normalization, document review, and lender stress tests. They want margins that are consistent, repeatable, and backed by clean records and a mixed customer base. That is why buyers look at both the multiple they are willing to pay and the amount of downside risk they need to cover.
Sub-$1M EBITDA businesses often trade at 3x–5x EBITDA, with better margins and customer diversification helping support the top end.
When margins look weaker, buyers usually shift more risk back to the seller. That often shows up through seller notes, earnouts, and escrows. Seller notes often run 10%–30% of price, and earnouts and escrows add more protection. Strong, steady margins lower the need for those protections and can lead to cleaner terms. The same margin quality that affects price also shapes how much debt the business can carry.
How lenders translate margin quality into debt service capacity
Valuation matters, but debt capacity is often what decides whether a deal gets done. Lenders underwrite DSCR, not margin by itself. DSCR is normalized cash flow divided by annual debt service. Many SBA lenders target 1.25x or higher, while conventional lenders often want 1.35x–1.50x or more.
This is where margin quality starts to hit home. A business with $3,000,000 in revenue and a 20% normalized operating margin produces about $600,000 of operating income. That supports a lot more acquisition debt at a 1.50x DSCR than a business running at a 10% margin. It’s a simple idea: stronger margins leave more room for debt payments.
Lenders also pressure-test the numbers. A common move is to model a 10%–20% revenue decline and see whether DSCR still stays above the minimum threshold. If it does not, lenders may cut the loan size, tighten covenants, or walk away from the deal.
They also look past the headline margin number and dig into what supports it. A few problem areas come up again and again:
- Aggressive or unsupported add-backs that do not survive review
- One-time items that inflate recent margins
- Heavy owner dependence that creates post-close risk
- Mismatches between internal financials and filed tax returns
Any one of those issues can shrink the loan, trigger more collateral requirements, or stop the deal cold.
Conclusion: The operating margin checks that matter most before close
Before signing off on an SMB acquisition, buyers should rebuild operating margin from source documents, not broker summaries. That means recalculating margin for at least three years plus TTM, documenting add-backs, and stress-testing the deal the way a lender would.
From there, margin analysis should tie straight into capital structure. Stable, well-documented margins can support more leverage and cleaner terms. Thin or choppy margins usually call for more equity, seller financing, and contingent consideration to keep the deal financeable and guard against downside. Operating margin underwrites valuation, leverage, and close certainty.
FAQs
What is a good operating margin for an SMB acquisition?
There’s no single “good” operating margin.
In SMB diligence, buyers use operating margin - (Operating Profit ÷ Revenue) × 100 - to judge how well a business turns sales into profit. It helps them look at efficiency, scalability, and earnings quality.
They usually review 3–5 years of margin trends, look at fixed versus variable costs, and check add-backs such as owner compensation, personal expenses, and non-recurring items.
When margins stay steady, that tends to support valuation and lender fit. When margins start shrinking, it can point to pricing pressure or poor cost control.
Which add-backs fail lender review?
Add-backs usually fall apart in lender review for a simple reason: they don't have the proof behind them. If an expense isn't well documented, isn't actually one-time or discretionary, or doesn't make sense once the numbers are normalized, it's likely to get pushed back or removed.
Buyers and lenders pressure-test operating margin by looking at SDE or Adjusted EBITDA. And they don't stop at a seller's summary. They back it up with tax returns, bank statements, payroll records, and GL detail, then compare margin trends across multiple years to see whether the numbers are accurate, sustainable, and repeatable.
How does margin affect how much I can borrow?
Margin shapes borrowing because it shows how well a business turns revenue into operating profit - and whether that profit holds up well enough to carry debt.
Buyers usually look at operating margin, clean up add-backs, and review three to five years of margin trends. They also look at how costs are split between fixed and variable expenses. When margins are strong and steady, lenders tend to feel better about debt service coverage. When margins are thin or slipping, lender fit can get tighter and valuation can come under pressure.
Related Reading
Find the right lender for your business
Whether it's working capital, an SBA loan, or acquisition financing — we'll match you with the right capital partner.
About the author
Principal & CEO/CIO
Samson Jagoras has 15+ years across finance, real estate, and business acquisitions. He began his career as a Futures & Commodities broker and later served as Chief Strategy Officer of an INC 500 marketing and technology firm, helping scale revenue from $1M to over $100M. Today he buys, builds, and advises a portfolio of companies with a focus on M&A, capital allocation, and operational strategy.