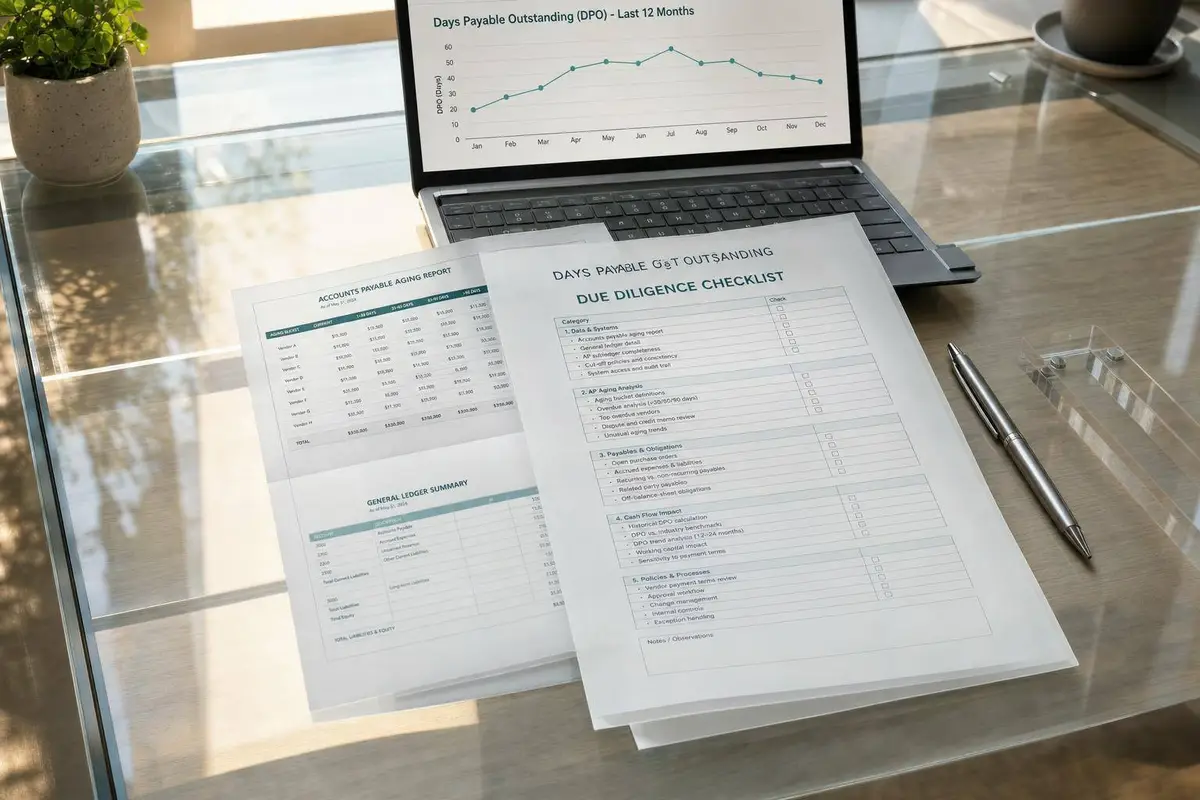
Days Payable Outstanding Due Diligence Checklist
Reconcile AP to the GL, track DPO trends, test vendor terms and accruals, and quantify working-capital and post-close cash needs.
 Samson JagorasPrincipal & CEO/CIOSeptember 22, 2026
Get a Quality of Earnings analysis you can trust
Our QofE team validates earnings, normalizes add-backs, and de-risks your deal — flat-fee with fast turnaround.
A high DPO can help cash flow - or hide late payments. When I review DPO in a small-business deal, I focus on one question: is the company using normal vendor terms, or is it stretching payables to hold cash?
Here’s the short version:
- I tie the AP aging to the general ledger
- I track DPO by month for 12–24 months
- I check whether old AP buckets are growing, especially 61–90 days and 90+ days
- I compare vendor contract terms to actual days paid
- I test accruals and period-end cut-off for payroll, taxes, rent, interest, and utilities
- I turn every issue into dollars that affect the working capital peg, purchase price, and day 1 to day 90 cash needs
A few numbers matter right away. If the top 5 vendors make up 50%–60% of AP, or one vendor drives 20%–25% of annual purchases, supplier risk goes up fast. And if 90+ day AP is above 5%, I treat that as a warning sign that post-close cash may be tighter than it looks.
In plain English: I’m not just checking a ratio. I’m checking whether reported payables are normal, whether liabilities are missing, and how much cash a buyer may need soon after closing.

DPO Due Diligence Checklist: 4-Step Framework for Buyers
How to Analyze Days Payable Outstanding

sbb-itb-a3ef7c1
Step 1: Review AP Aging and Build the DPO Trend
Start with the AP aging report before you dig into DPO. It shows when the company is actually paying bills, which matters a lot more than taking the balance at face value.
Reconcile Aging to the General Ledger
Pull the AP aging report and GL trial balance for the same month-end date. The total on the aging report should match the AP control account in the GL exactly.
If it doesn’t, look at the usual trouble spots:
- Manual journal entries posted straight to AP
- Unposted invoices
- Unapplied vendor credits
Track every difference back to a specific transaction. If any amount can’t be backed up, treat it as a diligence exception. That kind of gap can point to unrecorded liabilities or a working capital picture that looks better than it is ahead of a sale.
Once the aging ties to the GL, check whether the payment pattern lines up with stated terms or shows signs of vendor stretch.
Measure Overdue Balances and Track DPO Month by Month
Build a monthly DPO trend for at least 12 months. If you can, go out 24 months. Calculate monthly DPO using ending AP and average daily purchases, or use COGS as a consistent proxy.
Then layer in the aging bucket percentages. This helps you see why DPO is moving. A higher DPO can mean payment terms got better. Or it can mean invoices are sitting unpaid longer.
A steady increase in DPO, especially when 61–90 and 90+ day balances are also getting bigger, points to vendor stretch. Compare the same month across years - for example, December 2024 versus December 2025 - to separate seasonality from a deeper decline.
Quarter-end AP spikes that reverse in the next month may be fine if there’s a clear operating reason behind them. Spikes that stay put deserve a closer look.
Use the trend to figure out whether payment delays are spread across the vendor base or tied to a handful of suppliers.
Aging Bucket Diagnostic Table
Under normal Net 30–45 terms, most AP should fall into the current and 1–30 day buckets. If older buckets start swelling, reported liquidity may be getting support from delayed payments rather than normal operations.
| Aging Bucket | % of Total AP | Alert Threshold | Likely Diligence Implication |
|---|---|---|---|
| Current | Expected share: 50%+ | < 50% | Systematically late payments; terms may be weak or unenforced |
| 1–30 days | Typical share: 25%–35% | > 35% | Slight stretch; often batching or timing-related |
| 31–60 days | ≤ 10–15% | > 15% | Emerging payment delays; test vendor relationships |
| 61–90 days | ≤ 5–10% | > 10% | Potential cash strain; post-close catch-up payments likely |
| 90+ days | ≤ 5% | > 5% | High risk of vendor credit holds, disputes, or supply disruption |
Document the results in a structured memo. Include the DPO trend, bucket percentages across several month-ends, and a clear list of reconciling items marked as supported, estimated, or exception.
That aging trend becomes the starting point for testing vendor concentration and changes in payment terms.
Step 2: Test Vendor Concentration and Payment Term Changes
Once you've mapped the aging trend, the next step is to look at individual suppliers. A high-level DPO figure can hide a lot. In many cases, one or two vendors are doing most of the heavy lifting, while the rest of the AP ledger looks fine. That’s why aging outliers matter: they show which vendors are driving the stretch.
Measure Top-Vendor Concentration and Single-Source Exposure
Use the aging trend to pinpoint the vendors behind the overdue balance. Export the AP subledger and the 12-month vendor spend report from the accounting system, then rank vendors by both AP balance and annual purchases. From there, measure each vendor’s share of total AP and annual spend.
If the top five vendors make up more than 50%–60% of total AP, or if any single vendor accounts for more than 20%–25% of annual purchases, you’re looking at concentration risk. That can turn into a direct operating issue if a payment dispute, credit hold, or shipment hold hits revenue or production.
Pay close attention to any vendor that shows up in both groups:
- Top 5 by AP balance
- Top 5 by annual spend
Those are your critical suppliers, especially if replacing them would take weeks or months. Once you know who they are, compare their contract terms with when they actually get paid.
Compare Contracted Terms to Actual Days Paid
Pull the main vendor contracts and list the stated payment terms, such as Net 30, Net 45, Net 60, or discount terms like 2/10 Net 30. Then use AP transaction data to calculate actual days to pay for each vendor over the last 12 months.
The key number here is the variance:
actual days paid minus contracted days
That tells you where DPO is being pushed past the agreed terms.
Flag any variance above 10–15 days beyond contracted terms, then sort the cause into one of three buckets: stretch, approval lag, or dispute. Any of those can strain supplier relationships and trigger catch-up payments after close.
Missed early-pay discounts should be treated as avoidable cash cost and possible EBITDA upside.
Vendor Terms vs. Actual Payment Timing Table
Build this table by combining contract data with AP transaction history. Sort it by variance or concentration percentage so you can see, fast, where DPO inflation is piling up.
| Vendor / Category | Contracted Terms | Avg. Days Paid | Variance (Days) | % of Total AP | % of Annual Purchases | Risk Comment |
|---|---|---|---|---|---|---|
| Primary raw material supplier | Net 30 | 58 | +28 | 31% | 27% | Critical input; stretched payments can trigger shipment holds |
| Secondary packaging supplier | Net 45 | 49 | +4 | 14% | 11% | Minor stretch; within acceptable range |
| Key logistics partner | 2/10 Net 30 | 34 | +4 | 9% | 8% | Discounts consistently missed; EBITDA opportunity |
| Office & facilities vendor | Net 60 | 61 | +1 | 4% | 3% | On terms; low risk |
| Specialty component supplier | Net 30 | 72 | +42 | 18% | 16% | Sole-source; high risk of credit hold post-close |
A table like this shows, at a glance, whether overall DPO comes from disciplined working capital management or stress piled onto a small set of critical vendors. If vendor stretch doesn’t line up with stated terms, test accrued expenses and cut-off next.
Ready to Make Your Next Move?
Whether you're buying, selling, or investing — Clearly Acquired gives you the tools, data, and support to close with confidence.
Step 3: Check Accrued Expenses, Cut-Off, and Unrecorded Liabilities
Trade AP picks up invoiced supplier payables. Accrued expenses cover costs the business has already incurred but hasn’t been billed for yet. If either one is too low, EBITDA looks better than it should, and the working capital peg ends up too high. Then there’s one more problem: liabilities that never made it into AP at all.
Review Accrued Payroll, Taxes, Rent, Interest, and Utilities
Start with the accruals that most often go wrong: payroll, payroll taxes, rent, interest, and utilities.
- Accrued payroll: Check how many days of unpaid wages were sitting outstanding at period end and tie that amount back to the payroll register. If payroll runs every two weeks, you’d usually expect about 11–14 days of wages accrued at a mid-cycle measurement date. If payroll is under-accrued, the buyer will need more cash at close.
- Payroll taxes: Reconcile employer FICA, FUTA, and SUTA to statutory rates and IRS Form 941. A big payroll accrual with no matching tax accrual is a clear red flag.
- Accrued rent: Pull the lease and every amendment. CAM charges, escalation clauses, and unpaid rent from prior periods all need to be included. If rent accruals are missing, current liabilities look lower than they are, and normalized working capital looks too high.
- Accrued interest: Recalculate interest from the outstanding principal and the stated rate. If interest expense jumps around from month to month, that often points to skipped accrual periods. That can change both debt-service coverage and the payoff amount at close.
- Utilities: Compare the accrual to recent bills and estimate usage through period end when the billing cycle doesn’t line up. If utilities weren’t accrued, EBITDA gets inflated because the expense is pushed into a later period.
Once these balances seem right, the next step is simple: make sure they were booked in the right period.
Perform Cut-Off Testing Around Period End
Test a 30–60 day window around period end. Match receiving reports, open POs, vendor statements, and post-close disbursements to liabilities recorded at the measurement date. If the company made a material payment after close and there was no matching liability on the books, that’s a strong sign the obligation existed before close but wasn’t recorded.
Liability Type and Test Performed Table
| Liability Type | Source Evidence | Diligence Procedure | Impact on EBITDA / Working Capital |
|---|---|---|---|
| Trade AP | Vendor statements, receiving reports, AP aging | Match invoices and receipts to period-end liabilities; flag post-close payments with no recorded liability | Understated AP inflates working capital and masks future cash demands |
| Accrued Payroll | Payroll registers, Form 941, state filings, bonus plans | Tie days of unpaid wages to payroll cycle; reconcile payroll taxes to statutory rates | Under-accrual inflates EBITDA; first post-close payroll run will be larger than modeled |
| Accrued Taxes | Tax returns, state filings, payment schedules | Reconcile to statutory rates and taxable activity; review subsequent tax payments | Unaccrued taxes create successor liability and immediate post-close cash outflows |
| Accrued Interest | Loan agreements, amortization schedules, lender statements | Recompute interest from principal and rate; compare to recorded balance | Affects debt-service coverage and payoff amount at close |
| Accrued Rent & Utilities | Lease agreements, amendments, recent utility bills | Reconcile to lease terms and usage through period end; check for unpaid CAM charges | Under-accruals suppress current liabilities and overstate normalized working capital |
Record each gap as an adjusting item. Cut EBITDA in the affected period, then add the corrected liability into the working capital peg. Those adjustments help normalize AP before the peg is set.
Step 4: Convert Findings into Working Capital and Post-Close Cash Needs
Once you record the adjusting items from Steps 1–3, the job changes. At that point, you're no longer just reviewing AP. You're turning what you found into deal terms. Every gap in AP aging, accrued expenses, and cut-off testing should turn into a dollar amount that affects the working capital peg, the purchase price, and the first-90-day cash plan.
Set a Normalized AP Balance and Working Capital Peg
Use 12–24 months of monthly AP data to set a normalized month-end AP balance based on ordinary payment timing. Leave out quarter-end stretches, short-term cash pressure, and one-time purchases. That baseline should match the normal payment pattern confirmed in Steps 1–3, and it becomes the base for the working capital peg.
Then strip out anything that doesn't reflect steady operations. Overdue balances in the 90+ day bucket because the seller was holding cash shouldn't stay in the peg. Those amounts are catch-up obligations the buyer will likely take on, not normal trade credit. The same goes for short-term AP spikes tied to a one-time purchase or another timing issue. The peg should show what AP looks like when the business pays vendors on contracted terms, adjusted for the season closest to the expected closing date.
Benchmark DPO at 25–40 days for U.S. small businesses; if the variance is material and vendor terms haven't changed, AP usually needs normalization after close.
Estimate Post-Close Cash Needed to Normalize Payables
Turn the normalized AP peg and each exception from Steps 1–3 into cash needs by timing bucket. Size the liquidity need by combining overdue vendor catch-up, missing accruals, missed discounts, and any gap between current AP and the normalized peg.
| Cash Need Category | How to Estimate | Typical Timing |
|---|---|---|
| Overdue vendor catch-up | Sum AP more than 60–90 days past due and map payment timing by vendor priority and due date | Days 1–90 post-close |
| Missing accruals | Total unrecorded payroll, taxes, rent, interest, and utilities | Due at or shortly after close |
| Lost early-pay discounts | Annual spend × discount rate (for example, 2% on net-30 terms) to estimate savings you may miss if payments stay stretched | Ongoing; may require upfront liquidity |
| Working capital shortfall | Gap between the normalized AP level and the current balance sheet; use the difference to size any short-term funding need | First 60–90 days |
These amounts need to flow into the sources-and-uses model and the first-90-day cash forecast. They shouldn't sit in a diligence memo that never makes it into the financing plan.
Conclusion: DPO Diligence Checklist Summary and Next Steps
The full checklist covers five connected steps: reconcile AP aging to the general ledger and build a monthly DPO trend; test vendor concentration and compare contracted terms to actual payment timing; validate accrued payroll, taxes, rent, interest, and utilities; perform cut-off testing to catch unrecorded liabilities; and translate each finding into a normalized AP balance, an adjusted working capital peg, and a quantified post-close cash need. Each step builds on the one before it. Skip one, and that gap often shows up as a cash shortfall in the first 90 days of ownership.
Use this framework to size the AP peg, post-close cash need, and first-90-day forecast. The result is a cleaner working capital peg and a more realistic opening liquidity plan.
FAQs
What is a normal DPO range?
There’s no single normal DPO range.
In diligence, review 24–36 months of AP aging and tie it back to the general ledger and bank statements. Then look closely at:
- DPO trends
- Stretched payables
- Vendor concentration
- Payment term changes
- Accrued expenses
- Cut-off around period-end
You’ll also want to confirm post-close working capital needs. A good way to do that is with a trailing-12-month working-capital peg and 60–90 day true-up mechanics.
When does high DPO become a red flag?
High DPO turns into a red flag when it points to stretched payables. That often happens after late pre-sale changes meant to make working capital look better on paper.
Look at AP aging over 24–36 months. Check for rising balances. And make sure the aging ties back to the general ledger and bank statements. If those pieces don’t line up, that’s a problem.
Also review:
- Vendor concentration
- Payment term changes and change-of-control clauses
- Accrued expenses and cut-off testing
- 60–90 day post-close working capital needs
How does DPO affect post-close cash?
DPO shapes post-close cash in a few direct ways: payment timing, accrued liabilities, and the working-capital true-up.
Use an AP diligence checklist to review aging reports across the last 24–36 months. Look for late or unusual payment patterns, vendor concentration, and AP-like accruals that may sit outside the main AP balance.
It also helps to reconcile AP and debt schedules to the underlying statements. Then review vendor contracts for change-of-control clauses, and confirm which AP and accrual items are included in the working-capital peg and the post-close true-up.
Related Reading
De-risk your deal with a Quality of Earnings report
Independent, deal-ready earnings analysis that buyers, sellers, and lenders trust.
About the author
Principal & CEO/CIO
Samson Jagoras has 15+ years across finance, real estate, and business acquisitions. He began his career as a Futures & Commodities broker and later served as Chief Strategy Officer of an INC 500 marketing and technology firm, helping scale revenue from $1M to over $100M. Today he buys, builds, and advises a portfolio of companies with a focus on M&A, capital allocation, and operational strategy.