Revenue Trends: How Buyers Spot Weakness
Flat revenue can hide churn, discounting, and slow collections. How buyers use DSO, A/R aging, order size, and source documents to verify revenue and reprice risk.
 Samson JagorasPrincipal & CEO/CIOAugust 11, 2026
Find and close your next acquisition with expert backing
From sourcing to diligence to close — our buy-side team and platform help you win the right deal at the right price.
How Buyers Spot Weak Revenue Trends Early
If I’m buying a business, I don’t wait for late diligence to see if revenue is slipping. I check a few things up front: 3–5 years of financials, tax returns, bank statements, monthly sales reports, customer churn, discounting, A/R aging, DSO, and order size. If more than one of those starts to weaken at the same time, I assume the deal may need a lower price, tighter terms, or a hard stop.
Here’s the short version:
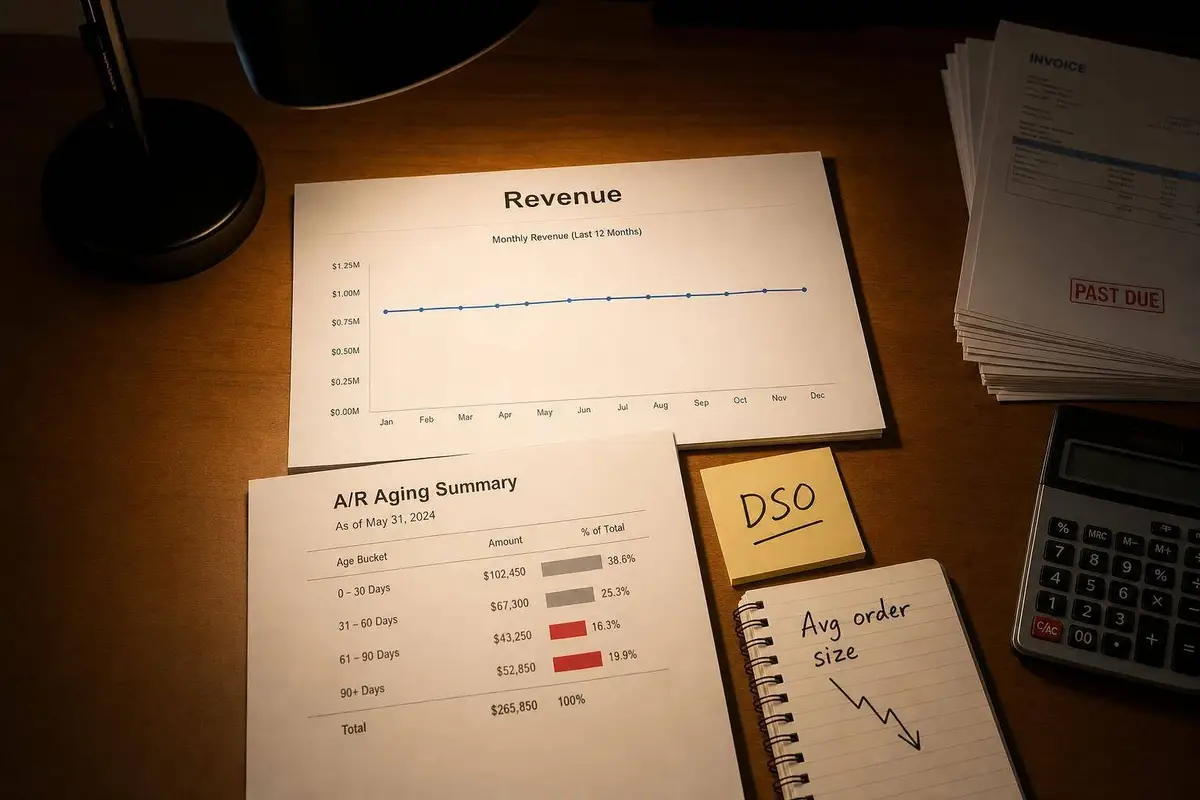
- Flat revenue can hide decline if customers are leaving or spending less.
- Customer concentration matters because one lost account can hit sales fast.
- Heavy discounting can keep revenue level while price strength falls.
- Late receivables and higher DSO can show trouble before reported revenue drops.
- Smaller orders and lower spend often point to soft demand.
- Source documents like bank deposits, invoices, contracts, sales tax filings, and tax returns help me test whether the seller’s story holds up.
I also look at whether reported revenue turns into cash. If A/R is drifting into the 61–90 or 90+ day buckets, or if bank deposits don’t line up with the income statement, I treat that as a warning. A business can look fine on paper while cash says something else.
My basic rule is simple: if revenue, customer health, pricing, and collections all weaken together, I dig deeper before I commit time or money.
| Signal | What I look for | What it can mean |
|---|---|---|
| Revenue trend | Flat or slowing sales over multiple periods | Demand may be weakening |
| Customer base | Churn or heavy concentration | Sales may depend on too few accounts |
| Pricing | Repeat discounts | The business may be struggling to hold price |
| Collections | Aging A/R and rising DSO | Revenue quality may be weak |
| Order patterns | Lower average order size or spend | Customers may be pulling back |
| Source records | Gaps between deposits, tax returns, and reported revenue | Revenue may be overstated or mistimed |
That’s the whole point of an early screen: verify the revenue story before you price the risk like it’s not there.

The first signals buyers check in revenue and customer data
Buyers don’t just take revenue claims at face value. They check whether the customer base underneath those numbers can actually support the story.
Flat revenue that masks real decline
A flat revenue line can look fine at first glance. But buyers usually dig deeper.
They compare company records with tax returns, bank deposits, invoices, and customer lists to see if the outside data matches what the seller says. If those pieces don’t line up, that’s a red flag. And even when revenue appears flat, buyers often shift to customer-level proof to see whether sales volume, retention, or pricing is already starting to slip.
Sharp customer loss and concentration risk
Stable revenue can hide a weak customer base for a while. That often happens when a company is losing customers but still leaning on a small number of accounts to keep sales in place.
So buyers check customer concentration, renewal patterns, and churn by account. The goal is simple: find out how stable the revenue base actually is before one big customer walks away.
Heavy discounting that props up sales but weakens pricing power
Discounting can keep revenue from dropping in the short term. But it can also signal that the business has trouble holding price.
When a seller depends on repeated discounts to keep deals moving, buyers read that as a pricing issue, not just a sales tactic. If discounts are doing the work of keeping revenue flat, the next thing buyers want to know is whether cash collection is starting to weaken too.
Cash flow signals that appear before reported revenue drops
After buyers check the topline, they usually move to one thing fast: cash. Revenue can look fine on the income statement while the cash picture starts to slip. That gap often hints at weak revenue quality before the reported numbers fall.
Late receivables and rising days sales outstanding (DSO)
Buyers dig into A/R aging reports by bucket: 0–30, 31–60, 61–90, and 90+ days. When more balances start piling up in the older buckets, it points to slower collections. In plain English, it shows whether recorded revenue is turning into cash the way it should.
They also look at concentration risk. If past-due balances are tied to just a small group of accounts, that gets more attention. A few slow-paying customers can distort the whole picture.
Shrinking average order size and lower customer spend
Buyers also track average order size and order frequency trends by quarter. Order count can stay flat while average order size drops. When that happens, demand may be weakening even if the topline still looks steady.
The smart move is to compare current performance with the business’s historical baseline. That helps separate a real trend from seasonality, or from a short-term spike or dip.
Once these patterns show up, buyers check them against source records. If the trend still looks weak, the next step is to test the seller’s claims against source documents. This verification is a critical part of how professionals source and manage acquisition opportunities effectively.
Get a Quality of Earnings analysis you can trust
How buyers verify seller claims and respond to weak trends
Verifying revenue from source documents
When the first pass points to a weak revenue trend, buyers need to find out if that trend is actually there or if the seller’s numbers are painting too rosy a picture.
At that stage, smart buyers stop leaning on the seller’s model and go back to the source. They reconcile reported revenue to bank deposits and compare those figures against invoices, sales tax filings, contracts, and A/R aging reports. They also line up filed tax returns with the financial statements shared during the sale process. On top of that, they test revenue cut-off around month-end and year-end to make sure sales were booked in the right period.
A Quality of Earnings review rebuilds revenue from source documents, normalizes earnings, and brings the key risk flags into the open.
What buyers change when the revenue trend is weak
A weak revenue trend doesn’t always kill a deal. But it almost always changes the risk math.
If the seller can’t explain the drop with clean source documentation, buyers may lower the price, tighten the terms, or walk away. Put simply, unverified trends should lead to a lower price, tighter terms, or an exit.
The point isn’t only to confirm that revenue is down. It’s to decide where that risk belongs: in price, in terms, or in the deal structure.
| Warning Sign | Buyer Concern | Likely Response |
|---|---|---|
| Bank deposits do not match reported revenue | Revenue may be overstated | Require further verification before moving forward |
| Tax returns differ from the financial statements | Reported results may not match filed records | Dig deeper before pricing the deal |
| Cut-off issues around month-end or year-end | Revenue may be recorded in the wrong period | Rework the revenue trend and adjust the view of earnings |
| A/R aging confirms cash conversion is weakening | Collections are slowing | Scrutinize working capital and liquidity needs |
| Source documents do not support reported revenue | The trend may be less reliable than presented | Reprice, tighten terms, or walk away |
When revenue is weak, buyers also often use earnouts or seller notes to keep more of the risk tied to verified post-close performance.
Using Clearly Acquired to centralize screening, Quality of Earnings, and financing decisions

Once verification shifts the risk view, financing has to shift too. That’s where Clearly Acquired comes in.
It puts screening, source documents, Quality of Earnings, and financing in one place, so buyers can price deals based on verified earnings and line up financing with verified cash flow.
Conclusion: Turn early warning signs into a clear go, reprice, or walk away
Weak revenue trends usually don’t show up in just one number. They tend to surface across a handful of signals at the same time. If you see flat growth, customer loss, discounting, or slow collections together, the issue shifts from “What does revenue look like?” to “Does this deal still support the price?”
That matters because flat revenue can mask deeper problems. A business may hold the topline steady while losing customers, giving up margin, or leaning on lower prices to keep sales moving. On paper, things can look fine. Under the hood, the story can be a lot less reassuring. Buyers who spot those patterns early have a much better shot at pressure-testing the seller’s claims instead of taking on the risk at full value.
The core takeaway is simple: a weak revenue trend should push you into deeper diligence. It can also support a lower valuation or tighter deal terms, such as a seller note or earnout.
A short checklist for every revenue review
Use the same signals from diligence when it’s time to make the call. Before moving forward on any deal, check:
- Revenue trend — Review growth, flat periods, or slowdown across multiple reporting periods.
- Customer concentration and loss — Look at reliance on a small number of accounts and any recent churn.
- Discounting and realized price — Test whether sales are holding up mainly because pricing has come down.
- Collections and order size — Review A/R aging, DSO, average order size, and customer spend.
- Source-document reconciliation — Tie reported revenue back to bank statements, tax returns, invoices, and contracts.
If these checks start to weaken the story, verify the numbers, reprice the deal, or walk away.
FAQs
What is DSO, and why does it matter?
DSO shows how long a business takes to collect payment after making a sale.
That matters because slow collections can point to weaker cash flow and possible issues with revenue quality.
For buyers, a rising DSO can act as an early warning sign. On paper, revenue may look solid. But if customers are taking longer to pay, that reported revenue may be less reliable than it seems.
How much customer concentration is too much?
Customer concentration becomes a problem when too much revenue comes from too few customers. If one big account walks away, the business can take a hard hit. That’s why buyers pay close attention to whether losing a single customer could weaken revenue in a meaningful way.
They don’t just take the seller’s word for it. They check the numbers at the customer level, including:
- Revenue by account
- Retention
- Receivables
- Order patterns
That review shows how much the business depends on a small group of buyers — and how exposed it may be if one of them pulls back.
When should weak revenue trends kill a deal?
Weak revenue trends should kill a deal when they point to deeper problems the seller can’t clearly explain or back up.
A few red flags tend to show up early:
- Flat growth
- Sharp customer loss
- Heavy discounting
- Late receivables
- Shrinking order size
When those issues show up, buyers need to check the seller’s claims with care. If the revenue story still doesn’t add up, that’s usually a sign to walk away.
Buy your next business with a full-stack team
Curated deal flow, Clara AI diligence, financing, and done-for-you advisory — all in one place.
About the author
Principal & CEO/CIO
Samson Jagoras has 15+ years across finance, real estate, and business acquisitions. He began his career as a Futures & Commodities broker and later served as Chief Strategy Officer of an INC 500 marketing and technology firm, helping scale revenue from $1M to over $100M. Today he buys, builds, and advises a portfolio of companies with a focus on M&A, capital allocation, and operational strategy.