How KPIs Drive Business Valuation in M&A Deals
Revenue quality, profitability, and customer metrics shape valuation multiples and deal terms in M&A transactions.
 Samson JagorasPrincipal & CEO/CIOJune 13, 2026

Sell your business for maximum value
Our sell-side advisors package, market, and negotiate your exit to qualified, verified buyers — confidentially.
Key Performance Indicators (KPIs) are critical for determining a business's value during mergers and acquisitions (M&A). Buyers use these metrics to assess a company's growth potential, profitability, and stability, which influence valuation multiples and deal terms. Here's the core takeaway:
- Revenue Quality: Recurring revenue models and predictable growth attract higher valuation multiples. For example, SaaS companies with high Net Revenue Retention (NRR) or subscription-based businesses often secure better deals.
- Profitability Metrics: Strong EBITDA margins and efficient cash management (e.g., Days Sales Outstanding under 45 days) signal a well-run business.
- Customer Metrics: High Lifetime Value to Customer Acquisition Cost (LTV:CAC) ratios and low customer concentration reduce risk and boost valuations.
Companies that track and improve KPIs before selling your business can command higher prices, while buyers use KPI analysis to negotiate better terms and ensure post-acquisition success. Tools like AI-driven platforms are increasingly used to analyze and benchmark these metrics.
The Market Valuation Lens: The 4 KPIs of Valuations (EBITDA, Multiples, Debt & Working Capital)

The Main KPI Categories That Affect Business Valuation
Understanding how KPIs influence valuation multiples is critical, especially in mergers and acquisitions (M&A). Buyers tend to focus on metrics that indicate whether a business can maintain and grow its earnings independently of its current owner. Among the many KPIs, three categories stand out: revenue quality, profitability, and customer economics. These categories offer a deeper look into a company’s ability to scale and withstand operational challenges.
Revenue Growth, Quality, and Predictability
Sustainable revenue growth is a key driver of higher valuation multiples. Companies growing at an annual rate of 15% or more often secure multiples that are 10% to 30% higher than those of stagnant or declining peers. However, growth fueled by one-off projects or a single large client tends to raise red flags for buyers. Such reliance on unsustainable sources of revenue can lead to valuation discounts.
Recurring revenue models are transforming valuations, even in traditionally transactional industries. Take the car wash industry, for example. Businesses that have adopted monthly membership programs are now valued at 6x to 10x EBITDA - comparable to software companies - because their revenue resembles a subscription model rather than one-time transactions. Similarly, insurance agencies with policy renewal rates exceeding 90% are seen as recurring revenue businesses, significantly boosting their valuation compared to firms reliant on new annual sales.
Profitability and Margin KPIs
Metrics like EBITDA margin and gross margin provide insight into how effectively a business converts revenue into profit. Companies with healthy margins are better positioned to manage cost fluctuations, invest in growth, or handle acquisition-related debt. While EBITDA often serves as the baseline for valuation, efficiency metrics like Days Sales Outstanding (DSO) can highlight operational excellence.
For instance, a DSO under 45 days suggests strong cash management, whereas a DSO exceeding 60 days may signal potential working capital issues.
Customer Retention, Concentration, and Lifetime Value
Customer concentration is a frequent concern in lower middle market M&A. If a single customer accounts for more than 20% of revenue, valuation discounts of 20% to 40% below industry medians are common. Similarly, businesses where the top three customers generate over 50% of revenue often receive offers that are 30% to 45% lower than those with a more balanced customer base.
On the other hand, strong customer metrics can significantly enhance valuation. Christoph Totter, Managing Partner at CT Acquisitions, emphasizes:
“Recurring revenue is the single biggest premium driver in LMM [Lower Middle Market] services.”
A high Lifetime Value to Customer Acquisition Cost (LTV:CAC) ratio demonstrates that a business efficiently acquires and retains customers, generating strong returns over time. Sellers who can showcase improving LTV trends across recent customer cohorts give buyers confidence that the business is not only growing but also becoming more efficient as it scales.
Next, we’ll examine how these KPI insights influence M&A strategies.
How KPI Analysis Informs M&A Strategy
How Sellers Can Use KPIs to Prepare for a Sale
Tracking KPIs well in advance of a sale is a smart move for sellers. By starting this process 12–24 months before listing, sellers can identify and address operational weaknesses before buyers uncover them during due diligence.
Focusing on specific metrics can lead to noticeable improvements. For example, reducing customer concentration to below 15% lowers risk. Similarly, keeping Days Sales Outstanding (DSO) under 45 days and aligning Revenue Per Employee with top-performing peers - like achieving $200,000 to $500,000 per employee in SaaS - can enhance valuation by 5–10%.
“Sophisticated sellers who implement KPI tracking 12–24 months pre-sale... identify and fix operational deficiencies before buyers discover them.” - Jaken Equities
These adjustments not only make the business more attractive to buyers but also pave the way for better deal terms.
How KPIs Shape Deal Terms and Underwriting
Strong KPIs can significantly influence how deals are structured. While EBITDA serves as a baseline for valuation, operational KPIs determine whether a business earns a higher or lower multiple. As Jaken Equities explains:
“EBITDA establishes valuation baselines, but operational KPIs determine whether buyers pay bottom-quartile or top-quartile multiples.”
When KPIs are solid and well-documented, buyers are more likely to offer higher upfront payments and rely less on earnouts. On the flip side, weak or unclear metrics - such as poorly explained Customer Acquisition Cost (CAC) or Lifetime Value (LTV) - can lead to less favorable deal terms, like lower cash at closing or performance-based earnouts. Companies with strong unit economics, such as LTV:CAC ratios above 5:1, often secure valuation premiums of 25–40% compared to peers with weaker metrics.
AI tools are transforming how underwriting incorporates KPI analysis. Platforms like Clearly Acquired use AI to analyze financials, flag risks, and compare metrics against market standards. Their Quality of Earnings service reconstructs a company’s financial profile using source documents - like bank statements and contracts - providing normalized earnings and defensible add-backs. This process minimizes disputes after the Letter of Intent (LOI) and strengthens the deal structure.
Once a deal is finalized, maintaining a focus on KPIs is critical for successful integration and growth.
Using KPI Data After the Deal Closes
After the acquisition, KPI tracking becomes a tool for validating the deal’s success. Buyers who monitored KPIs during due diligence gain a clear benchmark for evaluating performance. Metrics like gross margins, customer retention, and Revenue Per Employee help determine if projected synergies are being realized.
For private equity firms following a buy-and-build strategy - now a standard approach - consistent KPI monitoring is even more important. Dashboards can highlight areas where integration is succeeding and flag operational issues, such as poor working capital management, that might be eating into margins. Post-close KPI tracking provides the insights needed to create scalable, sustainable businesses over time.
Get a Quality of Earnings analysis you can trust
How KPIs Drive Valuation Across Different Industries
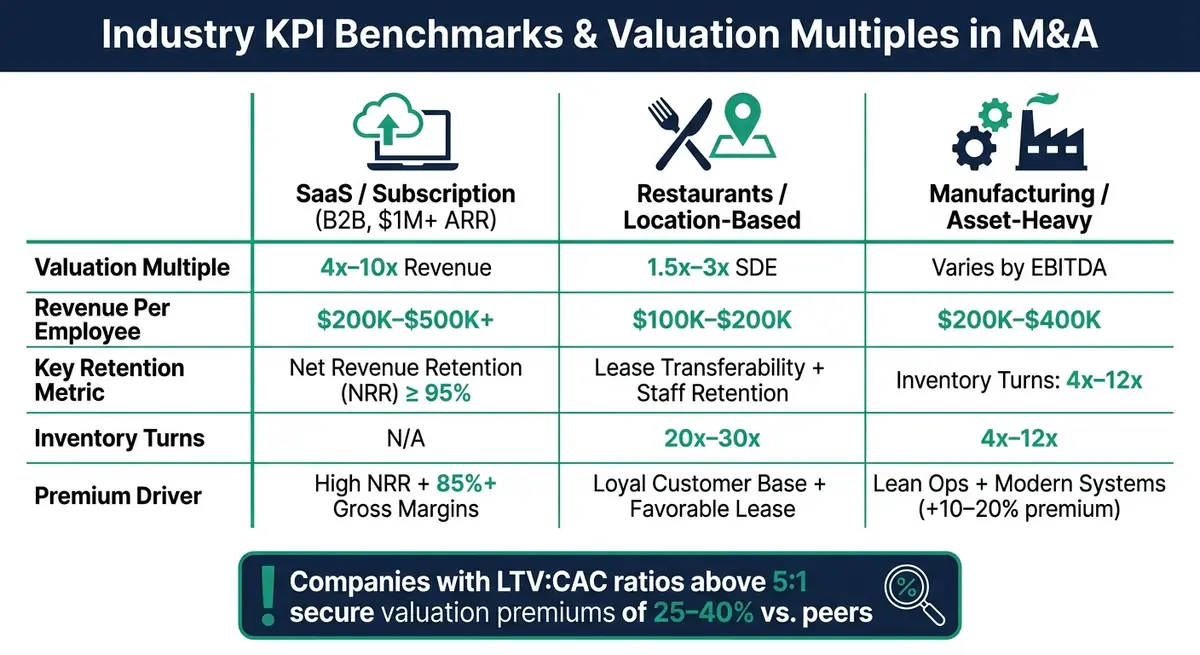
When it comes to evaluating businesses, industry-specific KPIs (Key Performance Indicators) play a critical role in shaping valuations. These metrics differ significantly depending on the type of business being assessed. For instance, the KPIs that influence the valuation of a SaaS company are vastly different from those that matter in a restaurant or manufacturing operation. Knowing which metrics buyers care about in your industry is just as important as tracking them from the outset.
Subscription and SaaS Businesses
In the world of subscription-based and SaaS businesses, recurring revenue is king. Metrics like Monthly Recurring Revenue (MRR), Annual Recurring Revenue (ARR), and Net Revenue Retention (NRR) are key indicators of a company’s stability and growth potential.
“Monthly recurring revenue (MRR) is the single most valuable revenue type across all industries.” - ExitValue.ai
ExitValue.ai further highlights the importance of retention and margins:
“A SaaS company with 95% net revenue retention and 85% gross margins commands multiples that dwarf project-based software shops with equivalent revenue.”
For high-growth B2B SaaS companies generating over $1M in ARR, valuations typically range between 4x and 10x revenue. Companies with less than $1M in ARR, however, usually see multiples in the 2x to 5x range. Additionally, churn rate is a critical factor - small increases in churn can have a compounding negative effect on valuation. These metrics underscore the unique dynamics of SaaS compared to other industries.
Restaurant and Location-Based Businesses
Restaurants and other location-based businesses operate on tighter margins, and their valuations reflect this reality. Smaller, owner-operated restaurants are generally valued at 1.5x to 3x Seller’s Discretionary Earnings (SDE). However, the final valuation often depends on operational and qualitative KPIs.
Buyers look beyond financials to assess factors like lease transferability, staff retention, and the strength of the restaurant’s concept. For example, a restaurant with a loyal customer base and a favorable, transferable lease presents a lower risk than one with high staff turnover or unfavorable lease terms. Additionally, inventory turnover is a critical metric for food-based businesses, with successful operations often achieving 20x to 30x inventory turns. These KPIs highlight the operational efficiency and risk profile of the business.
Manufacturing and Asset-Heavy Businesses
For manufacturing businesses, the focus shifts to operational efficiency metrics that reflect production capabilities. Revenue per employee and inventory turnover are two key indicators. Strong-performing companies typically generate $200K to $400K in revenue per employee and achieve 4x to 12x inventory turns. Businesses that exceed these benchmarks often demonstrate lean operations and advanced technology, which can justify higher valuations.
Systematic efficiency improvements, rather than one-off gains, can lead to valuation premiums of 10% to 20%. Private equity buyers, particularly those employing a buy-and-build strategy, are drawn to manufacturing platforms with modern systems and clear plans for integrating future acquisitions.
| Industry | Typical Multiple Range | Revenue per Employee | Inventory Turns |
|---|---|---|---|
| B2B SaaS ($1M+ ARR) | 4x–10x revenue | $200K–$500K+ | N/A |
| Restaurants (Small) | 1.5x–3x SDE | $100K–$200K | 20x–30x |
| Manufacturing | Varies by EBITDA | $200K–$400K | 4x–12x |
Conclusion: Using KPI Analysis to Improve Valuation and Deal Outcomes
KPIs do more than just measure performance; they help define where a business stands within its industry's valuation range. This, in turn, influences the outcomes of transactions for both buyers and sellers. As Jaken Equities explains:
“EBITDA establishes valuation baselines, but operational KPIs determine whether buyers pay bottom-quartile or top-quartile multiples.”
The difference between these multiples directly impacts enterprise value. For example, average middle-market M&A valuations are projected to reach 9.8x EV/EBITDA in 2025, an increase from 9.4x in 2024. In this context, improving KPI performance has never been more vital.
For sellers, tracking KPIs well in advance of going to market creates a solid data history. This not only boosts credibility but also signals the management expertise needed to command higher valuations. On the other hand, buyers gain an edge by focusing on rigorous KPI analysis, which sharpens their ability to evaluate deals and provides a clearer understanding of a business's true worth.
Technology is increasingly central to this process. Platforms like Clearly Acquired offer tools that benefit both sides. For sellers, its AI-driven valuation tools help identify and address financial gaps before due diligence begins. For buyers, its AI-powered underwriting capabilities spotlight KPI trends that separate strong opportunities from higher-risk investments, enabling faster and more accurate assessments compared to traditional methods.
FAQs
Which KPIs most influence valuation multiples in an M&A deal?
When it comes to M&A deals, certain key performance indicators (KPIs) play a major role in shaping valuation multiples. These include:
- Recurring revenue percentage: Companies with a higher share of predictable, recurring revenue are often more attractive to buyers.
- Customer concentration: A diversified customer base reduces risk, making the business more appealing.
- Growth rate: Strong, consistent growth signals potential for future success.
- Revenue per employee: This metric highlights operational efficiency and productivity.
- Gross margins: Healthy margins indicate profitability and operational strength.
In short, businesses that excel in these areas - offering stable revenue, reduced risk, and solid financial performance - tend to secure higher valuation multiples.
How far in advance should I start tracking KPIs before selling my business?
Tracking KPIs 12 to 24 months before selling your business is a smart move. This timeframe gives you space to spot any operational weaknesses, highlight solid management practices, and improve your valuation. By preparing early, you can better showcase your business’s potential and make the sale process much smoother.
What KPI red flags usually lead to earnouts or lower cash at closing?
When evaluating key performance indicators (KPIs), certain red flags can raise concerns for buyers and impact valuation. For instance, discrepancies in working capital, such as falling short of expected levels, can lead to direct price reductions - often matching the shortfall dollar-for-dollar.
Operational challenges also stand out as warning signs. These include:
- High customer concentration: Relying heavily on a small group of customers poses risks.
- Poor customer acquisition costs (CAC): Inefficient spending to gain new customers can hurt profitability.
- Low retention rates: Difficulty keeping customers signals underlying issues with satisfaction or value.
- Inefficient metrics: Metrics like high Days Sales Outstanding (DSO) or slow inventory turnover suggest inefficiencies in managing cash flow and operations.
Such issues not only raise buyer concerns but can also lead to adjustments in valuation, as they highlight potential risks or inefficiencies within the business.
Sell with advisors who maximize your outcome
From valuation and positioning to closing the deal, we run a competitive process to get you the best terms.
About the author
Principal & CEO/CIO
Samson Jagoras has 15+ years across finance, real estate, and business acquisitions. He began his career as a Futures & Commodities broker and later served as Chief Strategy Officer of an INC 500 marketing and technology firm, helping scale revenue from $1M to over $100M. Today he buys, builds, and advises a portfolio of companies with a focus on M&A, capital allocation, and operational strategy.