Historical Cash Flow Analysis During Due Diligence
A business can show profit and still run short on cash. Here is how I reconcile tax returns, P&Ls, and bank records to verify repeatable cash flow, realistic add-backs, working capital, and debt capacity during due diligence.
 Samson JagorasPrincipal & CEO/CIOJuly 3, 2026

Get a Quality of Earnings analysis you can trust
Our QofE team validates earnings, normalizes add-backs, and de-risks your deal — flat-fee with fast turnaround.
A business can show profit and still run short on cash. When I review a deal, I want to know if cash flow held up over the last 3 to 5 years, if it can support debt at about 1.25x DSCR, and if seller add-backs still hold after review.
Here’s the short version:
- I compare tax returns, P&Ls, and bank statements to see if the numbers match.
- I check whether revenue turned into cash, not just accounting profit.
- I remove weak or poorly supported add-backs because diligence often cuts 10% to 30% of them.
- I look at AR, AP, inventory, and customer concentration to see where cash gets stuck.
- I test whether the deal still works if adjusted EBITDA drops by 5% to 15%.
- I use those findings to judge price, debt size, and closing terms.
Bottom line: if cash flow is steady, documented, and repeatable, the deal is easier to finance. If not, I would cut the price, change the structure, or walk away.
The rest of the article explains how I would check that step by step.
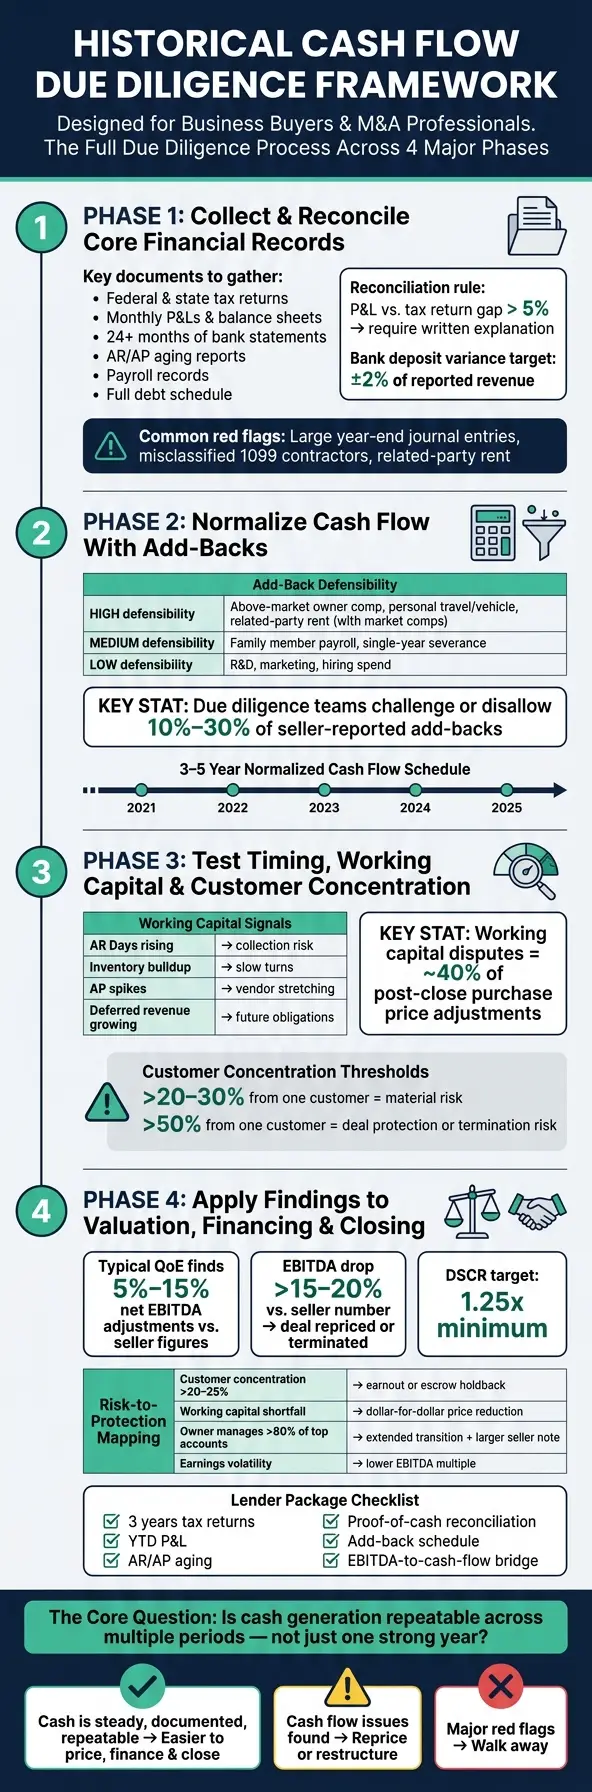
Historical Cash Flow Due Diligence: Step-by-Step Framework
Collect and Reconcile the Core Financial Records
The Minimum Document Set for a Cash Flow Review
Before you analyze anything, get the full record set in one place and tie cash flow out line by line.
Ask for federal and state tax returns, monthly profit and loss statements, and balance sheets. You’ll also want at least 24 months of bank statements, general ledger detail, accounts receivable (AR) and accounts payable (AP) aging reports, payroll records, and a full debt schedule that lists every loan, equipment lease, and personal guarantee.
That set gives you enough history to spot seasonality, working capital strain, and patterns that a single year of financials can miss.
Once the records are in hand, reconcile reported revenue, bank deposits, and balance sheet changes against one another.
How to Reconcile Tax Returns, P&Ls, and Bank Activity
Start with the tax return as your baseline because it is filed under penalty of perjury. Then compare it with the internal P&Ls year by year. If the gap between reported P&L revenue and tax return revenue is more than 5%, ask for a written explanation.
Next, run a cash reconciliation. Compare total deposits from the main operating bank account to reported revenue, but strip out internal transfers, loan proceeds, and owner contributions first. After those exclusions, aim for a variance within ±2%.
The table below shows what each record adds to the process, and where it can mislead you:
| Document | Strength in Diligence | Key Limitation |
|---|---|---|
| Tax Returns | High reliability; filed with the IRS under penalty of perjury | Often prepared to minimize taxes rather than show true earning power |
| Internal P&Ls | Monthly granularity and operational detail | Can be distorted by journal entries or expense timing |
| Bank Statements | Shows actual cash movement | Includes non-revenue items that must be manually excluded |
| General Ledger | Line-level detail behind every entry | Requires manual review to identify reclassifications and timing adjustments |
If anything still doesn’t tie after this step, put it on the exception list for deeper review.
Where Inconsistencies Usually Appear
Most issues show up in the same few places. Large year-end journal entries and reclassifications between expense categories can cover up weak performance, which is why the general ledger matters so much. Missing payroll taxes and misclassified 1099 contractors also come up often. The same goes for related-party pay or rent paid to affiliated entities, which should be normalized if the amount falls outside market range.
Each one of these gaps changes normalized cash flow. And that, in turn, shapes buyer confidence in how steady the business’s cash generation looks.
Five Cash Flow Traps That Destroy M&A Deals (Practitioner Checklist)

Normalize Cash Flow With Add-Backs and One-Time Adjustments
After you reconcile tax returns, P&Ls, and bank activity, the next step is to turn reported earnings into normalized cash flow. In most deals, that means adjusted EBITDA.
The key is simple: only use specific, documented add-backs that won’t continue after closing. Then stress-test those numbers. Do they still make sense once you factor in working capital, timing issues, and customer mix? That’s where a clean-looking EBITDA figure can start to crack.
Which Owner Add-Backs Are Generally Defensible
The most common add-backs that buyers will often accept include above-market owner compensation, personal travel, entertainment, vehicle expenses, family member payroll for nonessential roles, and related-party rent above market. But none of these should be taken at face value. Each one needs support from payroll records, invoices, bank statements, job descriptions, or market comps.
Related-party rent needs a market check before you accept any adjustment. And family payroll should only be adjusted when the role is plainly nonessential and would not need to be replaced after the deal closes.
By contrast, R&D, marketing, and hiring spend usually don’t make the cut as discretionary add-backs. Buyers tend to treat those as normal operating costs. In practice, financial due diligence teams often challenge or disallow 10% to 30% of seller-reported EBITDA add-backs. So every adjustment has to survive buyer underwriting, not just seller logic.
Once the add-backs are set, look at whether cash flow holds up from year to year or whether timing is making the business look stronger than it is.
| Add-Back Category | Defensibility | Underwriting Risk If Overstated |
|---|---|---|
| Above-market owner compensation | High | Overstates free cash flow if replacement cost is understated |
| Personal travel, entertainment, or vehicle expenses | High with documentation | Low if business purpose cannot be shown |
| Family member payroll | Medium | Requires proof the role will not need to be backfilled |
| Single-year severance | Medium | Disallowed if severance is recurring |
| R&D, marketing, and hiring spend | Low | Usually rejected; treated as ongoing operating expense |
| Related-party rent above market | High with market comps | Distorts true occupancy cost if not benchmarked |
How to Separate One-Time Expenses From Ongoing Costs
A good test is this: will the cost go away after closing, or will it just come back with a new label?
A single year of severance may count as non-recurring. But if severance shows up every year, it’s part of operations.
The same goes for repeated “one-time” charges. If they keep appearing across multiple trailing periods under different names, that’s a warning sign. Maybe one year it’s extraordinary repairs. The next year it’s consulting fees. Different label, same pattern. Costs like that should usually be treated as normal operating expenses, not exceptions.
Build a 3 to 5 Year Normalized Cash Flow Schedule
Put each year side by side in a single schedule. Start with reported net income. Add back non-cash charges like depreciation and amortization. Then apply only the add-backs that made it through documentation review.
This schedule helps you see the story behind the numbers. Stable normalized cash flow points to repeatable earnings. If the trend falls even after add-backs, that deserves a closer look. Over a 3 to 5 year period, you can see whether cash flow is steady, slipping, or leaning too hard on one strong year.
That consistency check leads straight into the next part of the review: timing swings, working capital, and customer concentration.
Test Timing Swings, Working Capital, and Customer Concentration
With normalized cash flow in hand, the next step is simple: check whether cash showed up on time and whether it came from sources that are likely to stick around.
Spot Timing Swings That Can Mislead Buyers
Start by checking whether reported revenue turned into cash in the same period. The two usual reasons it doesn’t are seasonality and slow collections.
A seasonal business isn’t a problem by itself. Plenty of healthy companies have uneven cash patterns. The key is consistency. If the pattern repeats year after year, buyers can usually work with that. If the swings start moving around for no clear operating reason, that’s when people get nervous.
Compare monthly and trailing-12-month bank deposits to reported revenue. A variance of more than ±2% needs review.
If that timing check looks clean, move to the next issue: whether working capital is eating up cash.
Measure Working Capital Pressure on Historical Cash Flow
Working capital is often the reason reported earnings don’t show up in the bank account.
If accounts receivable keep rising, the business may be booking revenue without collecting cash. If accounts payable are shrinking, the company may be paying vendors faster — or it may have stretched payables in the past and can’t do that anymore. And when inventory builds up, that can point to slower turns or old stock sitting on the shelf.
Buyers often set a working capital peg using the 12- to 24-month average of net working capital, excluding cash and debt. If actual working capital at closing is above or below that peg, it can lead to a dollar-for-dollar purchase price adjustment. That’s not a small footnote, either. Disputes over working capital targets account for roughly 40% of post-close purchase price adjustments.
| Working Capital Trend | Signal of Stable Cash | Signal of Cash Strain |
|---|---|---|
| AR Days (DSO) | Consistent or declining, with little 90+ day aging | Increasing days; possible collection issues |
| Inventory Turns | Steady or improving turnover | Buildup of slow-moving or obsolete stock |
| AP Timing (DPO) | Predictable vendor payments | Sudden AP spikes; vendors being stretched |
| Deferred Revenue | Minimal or declining | Large balances representing future obligations |
Also watch for debt-like items such as accrued PTO, deferred revenue, and customer deposits. Buyers often treat these as purchase price reductions because they’ll be the ones covering the future cash outflows.
Analyze Customer Concentration and Cash Generation Consistency
Once working capital checks out, look at customer concentration. This is where things can get shaky fast. A business may look fine on paper, but if too much cash flow depends on one or two accounts, the risk goes up in a hurry.
Ask for the top customer list by revenue for each of the past three fiscal years. Then calculate how much of total revenue comes from the top 1, 5, and 10 customers. After that, check whether the same customers keep showing up or whether the mix keeps changing. That tells you whether the revenue base is steady or starting to drift.
Any single customer above 20% to 30% of revenue is a material concentration risk, and concentration above 50% can trigger deal protections or stop the deal. That matters because a small group of accounts can end up controlling both revenue and cash flow.
Long-term contracts, strong renewals, and company-level relationships help support cash flow that holds up better over time.
Apply Historical Cash Flow Findings to Valuation, Financing, and Closing
Turn Diligence Findings Into Valuation and Debt Capacity
Use normalized cash flow findings to set price, debt capacity, and closing terms.
Adjusted EBITDA is the starting point for both price and debt sizing. A typical Quality of Earnings review finds net adjustments of 5% to 15% compared with seller-reported EBITDA. If diligence brings adjusted EBITDA down by more than 15% to 20% versus the seller’s number, the deal is often repriced or terminated.
After that, lenders underwrite that same cash flow to decide how much debt the business can carry. Debt capacity follows adjusted cash flow. If working capital strain, timing swings, or customer concentration hurt cash conversion, the business may support less debt than the headline EBITDA suggests. That usually means more equity, a larger seller note, or a lower purchase price.
Diligence findings also shape closing protections. And in many cases, those same issues show up in lender requirements during the financing process.
| Risk Factor | Threshold | Typical Deal Protection |
|---|---|---|
| Customer Concentration | One customer above 20%–25% of revenue | Valuation discount, earnout, or escrow holdback |
| Working Capital Shortfall | Closing NWC below the historical target | Dollar-for-dollar purchase price reduction |
| Owner Dependency | Owner manages >80% of top accounts | Extended transition; larger seller note |
| Earnings Volatility | Inconsistent margins across 3–5 years | Lower EBITDA multiple; higher seller note |
| Tax/Legal Exposure | Unresolved pre-close items | Specific indemnification; increased escrow |
Prepare a Lender-Ready Cash Flow Package
SBA lenders usually want to see three years of federal business tax returns, year-to-date P&L statements, current AR and AP aging reports, a proof-of-cash reconciliation, a documented add-back schedule, and written explanations for timing swings or customer concentration issues. Bank statements and tax returns should line up with the revenue story shown in the financials.
The most important piece is the EBITDA-to-cash-flow bridge. This schedule shows how adjusted EBITDA turns into free cash flow after working capital needs and capital expenditures. That’s what lenders focus on. They care about cash conversion, not just whether the file looks complete. Undocumented add-backs often cause problems and are often rejected during underwriting.
Ready to Make Your Next Move?
Whether you're buying, selling, or investing — Clearly Acquired gives you the tools, data, and support to close with confidence.
Conclusion: Key Tests of Durable Cash Generation
Historical cash flow analysis comes down to one question: Is the cash generation repeatable across more than one period, not just one strong year?
If the answer is yes, the deal is easier to price, finance, and close. If not, buyers should reprice, restructure, or walk away.
FAQs
Why can a profitable business still have weak cash flow?
A business can be profitable on paper and still struggle with cash flow. That’s because profit is an accounting number. It doesn’t tell you how much cash is actually sitting in the bank.
For example, cash can get stuck in accounts receivable or inventory, even when the P&L shows earnings. So the company may look healthy in its financial statements while still feeling squeezed day to day.
A few other common reasons:
- Seasonal swings that create uneven inflows during the year
- Slow customer payments that delay cash coming in
- Ongoing cash burn from day-to-day costs
- Poor working capital management
- High capital spending that uses cash faster than it comes back
Put simply, a company can make money and still run short on cash if too much of that money is tied up elsewhere.
What add-backs are most likely to be rejected in diligence?
Buyers often push back on add-backs that don’t have clear proof behind them. That usually means missing receipts, payroll records, bank statements, or other backup. And when that happens, these weak adjustments often become a major reason for price disputes after the LOI.
Some add-backs get extra scrutiny right away. That includes recurring expenses framed as one-time costs, deferred expenses used to make earnings look higher, and owner perks or above-market compensation that aren’t fully backed up. If those items can’t stand up in lender underwriting, they often won’t be approved.
How do customer concentration and working capital affect deal terms?
Customer concentration and working capital often shape deal terms. They can lead to price cuts, escrow holdbacks, or a different deal structure.
If one customer makes up a big share of revenue, buyers usually see more risk. That can push value down.
Buyers also look closely at customer contracts. They want to know how stable that revenue is and what could change after closing.
Working capital usually sets a closing target based on past trends. If the business comes in below that target, the purchase price can drop dollar for dollar.
De-risk your deal with a Quality of Earnings report
Independent, deal-ready earnings analysis that buyers, sellers, and lenders trust.
About the author
Principal & CEO/CIO
Samson Jagoras has 15+ years across finance, real estate, and business acquisitions. He began his career as a Futures & Commodities broker and later served as Chief Strategy Officer of an INC 500 marketing and technology firm, helping scale revenue from $1M to over $100M. Today he buys, builds, and advises a portfolio of companies with a focus on M&A, capital allocation, and operational strategy.