AR & AP Trends Buyers Must Know
Why analyzing 2–3 years of AR and AP trends — not single snapshots — is the difference between a confident close and an undercapitalized acquisition.
 Samson JagorasPrincipal & CEO/CIOMay 27, 2026

Get matched with the right lender for your business
Compare offers from our vetted network. Pre-qualify in minutes — no impact to your credit.
When purchasing a business, Accounts Receivable (AR) and Accounts Payable (AP) trends reveal the true state of cash flow and working capital — key factors that can make or break a deal. A single financial snapshot can be misleading, so analyzing 2–3 years of AR/AP data is critical. Here's why this matters:
- AR (Accounts Receivable): Tracks customer payments. High overdue AR signals slow collections, which can strain cash flow.
- AP (Accounts Payable): Tracks payments to vendors. Delayed AP may indicate cash flow issues or manipulation before a sale.
- Key Metrics: AR aging, Days Sales Outstanding (DSO), bad debt trends, and customer concentration directly impact valuation and lender confidence.
- Working Capital Adjustments: AR/AP trends influence the purchase price through working capital pegs, which are adjusted post-sale.
Tools like Clearly Acquired's Clara AI can simplify due diligence by automating AR/AP analysis, identifying risks, and ensuring buyers make data-driven decisions. This process is essential for avoiding hidden liabilities, securing financing, and negotiating fair deal terms.
Accounts Receivable and Accounts Payable Explained

Key AR Metrics Buyers Should Review
When assessing a business for acquisition, reviewing Accounts Receivable (AR) metrics is essential. These figures offer a clear picture of the company's cash flow health and help identify potential adjustments to working capital. They also play a critical role in shaping deal terms, valuation, and lender confidence.
AR Aging and Collection Patterns Over Time
An AR aging report categorizes outstanding receivables into time brackets — typically current, 1–30 days, 31–60 days, 61–90 days, and over 90 days past due. By examining these brackets over several years, you can determine whether the company collects payments consistently or if slow-paying clients are becoming a problem.
Pay close attention to receivables older than 60 or 90 days. A growing percentage in these categories could signal relaxed credit policies or a weakening customer base. This directly impacts the working capital peg in the purchase agreement. If collections are delayed, the business might close with much less cash than its income statement suggests.
To confirm the validity of AR, cross-check it with bank deposits, invoices, and tax filings to ensure the receivables are genuine and collectible.
After this, evaluate the company's overall collection efficiency using Days Sales Outstanding (DSO).
Days Sales Outstanding (DSO): What It Measures and Why It Matters
Days Sales Outstanding (DSO) calculates the average time it takes the business to collect payment after a sale:
DSO = (Accounts Receivable ÷ Total Credit Sales) × Number of Days
For example, a DSO of 30 days means the company collects payments within a month, while a DSO of 60–75 days forces the business to fund operations longer before receiving cash.
Rather than focusing on a single DSO figure, analyze the trend over time. A rising DSO indicates slower collections, which can strain cash flow and raise concerns about credit practices. For buyers planning to take on acquisition debt, a high or worsening DSO could jeopardize meeting lender requirements, such as the minimum Debt Service Coverage Ratio of 1.25x for SBA 7(a) loans.
Understanding DSO trends also lays the groundwork for analyzing bad debt and write-offs.
Bad Debt and Write-Off Trends
Bad debt reflects receivables the business has deemed uncollectible. Monitoring write-offs as a percentage of revenue can reveal whether the company enforces strict credit policies or extends credit too freely to customers who fail to pay.
An increase in write-offs may point to issues like a shrinking customer base, overly lenient payment terms, or inflated income reports due to uncollectible receivables. During due diligence, a transaction CPA can identify these red flags through a Quality of Earnings (QofE) report, which highlights unsupported add-backs or receivables that should be written off rather than carried at full value.
"A Quality of Earnings report is the professional standard for verifying normalized earnings before closing."
If bad debt is rising, it could justify a lower purchase price or a higher working capital target at closing.
Customer Concentration in AR
High customer concentration is a major risk in small business acquisitions. If a large portion of AR comes from one or two customers, the company's cash flow becomes vulnerable, and its valuation may take a hit.
For instance, when a single customer accounts for more than 15% of revenue, it often leads to a risk adjustment in valuation. If that figure exceeds 20%, SBA lenders may flag it as a concern, and if it surpasses 40%, securing conventional financing could become nearly impossible. A top customer contributing over 30% of revenue can reduce the valuation multiple by 1.0 to 2.0 turns.
| Customer Concentration Level | Valuation Multiple Impact | Buyer/Lender Perception |
|---|---|---|
| No customer >10% | 0 turns (Neutral) | Well-diversified; low risk |
| Top customer 10–20% | −0.2 to −0.5 turns | Minor concern; yellow flag for SBA |
| Top customer 20–30% | −0.5 to −1.0 turns | Significant risk; triggers earnouts |
| Top customer 30%+ | −1.0 to −2.0 turns | High risk; deal restructuring likely |
| Top customer 40%+ | Deal kill (likely) | Generally unfundable for SBA loans |
Beyond the numbers, it's vital to determine whether key customer relationships depend on the current owner or the business itself.
"A contract reduces uncertainty — not dependency."
If a major client stays loyal primarily because of the founder, this creates a transition risk that no contract can fully eliminate.
Key AP Metrics Buyers Should Review
Just like detailed AR metrics shed light on a business's cash collection process, Accounts Payable (AP) metrics help reveal how effectively a company manages its financial obligations. They show whether a business pays its bills on time or is stretched too thin financially.
AP Aging and Payment Behavior Over Time
An AP aging report categorizes outstanding payables based on how long they've gone unpaid — usually grouped as current, 1–30 days, 31–60 days, 61–90 days, and over 90 days. Examining these trends over time can highlight potential issues. For instance, if payments consistently fall into the 60–90+ day categories, it may point to cash flow challenges rather than strategic payment management.
This distinction is crucial. While negotiating longer payment terms can help preserve cash, repeatedly delaying payments without planning suggests financial strain.
Keep an eye out for sudden changes in AP aging trends leading up to a sale. For example, a seller delaying vendor payments just before closing could be artificially boosting cash reserves — a red flag that might necessitate a working capital adjustment in the purchase agreement. To verify accuracy, always cross-check AP aging reports with bank statements and the general ledger to ensure reported expenses align with actual cash outflows.
Days Payable Outstanding (DPO): What It Measures and Why It Matters
Days Payable Outstanding (DPO) calculates the average time a business takes to pay its suppliers:
DPO = (Accounts Payable ÷ Cost of Goods Sold) × Number of Days
A higher DPO means the business delays payments, which isn't always a bad thing. Strong businesses may negotiate longer terms as part of their cash management strategy. However, a rising DPO trend could signal trouble, suggesting the business is struggling to meet its obligations.
For buyers, DPO trends directly affect the working capital mechanism in a purchase agreement. If a seller has been postponing payments to inflate cash reserves before a sale, the buyer inherits those unpaid liabilities. This typically leads to a dollar-for-dollar reduction in the purchase price. To avoid manipulation, using a trailing twelve-month (TTM) average to set the working capital target is a smart approach.
"The premise: the seller should not drain the business of its working capital before selling it, and the buyer should not pay for excess cash the seller leaves behind." — Alex Lubyansky, Esq., Acquisition Stars
Supplier Concentration and Dependency Risk
Supplier concentration risk mirrors customer concentration risk and can significantly affect a deal's feasibility. If one vendor accounts for more than 15% of total purchases, it's worth digging deeper. When supplier reliance reaches 25%–30%, buyers often reduce valuations or add earnouts to the deal structure. At 40% or more, the dependency could even jeopardize the transaction.
The nature of the supplier relationship also matters. Some vendors offer "friend pricing" — special rates tied to personal relationships with the current owner. These discounts may not carry over to a new buyer, potentially inflating costs post-sale. If margins are based on below-market pricing, the business might look more profitable on paper than it will be in reality.
It's also critical to review vendor contracts for change-of-control clauses, which can allow suppliers to renegotiate or terminate agreements after a sale. A contract that appears stable now could introduce risks or additional costs during the transition.
| Supplier Concentration | Risk Perception | Typical Deal Impact |
|---|---|---|
| < 10% of total spend | Well-diversified | No multiple adjustment |
| 15%–20% of total spend | Emerging risk | Minor multiple compression (0.2–0.5 turns) |
| 25%–30% of total spend | Significant risk | Valuation haircut or earnout requirement |
| > 40% of total spend | Critical dependency | Deal restructuring or potential deal killer |
"The more predictable and diversified future cash flows are, the higher the valuation multiple." — Lockwood & Associates Inc.
These AP metrics play a critical role in shaping deal structures, influencing both working capital adjustments and overall valuation.
How AR and AP Trends Connect to Deal Structure
AR (Accounts Receivable) and AP (Accounts Payable) trends don't just reflect a company's daily operations — they play a key role in shaping deal structures. From determining the purchase price to influencing a lender's confidence, these financial metrics are central to the acquisition process.
The Working Capital Peg and Purchase Price Adjustments
In most acquisitions, the purchase agreement includes a working capital peg — a target level of net current assets that the seller must deliver at closing. This peg is often calculated as a trailing twelve-month (TTM) average of AR minus AP and other current liabilities. Why? To prevent last-minute manipulation of financials. Trends in AR aging and Days Payable Outstanding (DPO) directly influence this peg.
Here's how the adjustment works: if the actual working capital at closing is higher than the peg, the purchase price increases by the same amount. If it's lower, the buyer gets a reduction. This adjustment, or "true-up", is typically finalized 60 to 90 days after closing, once the final balance sheet is prepared.
"Working capital adjustments and earnout structures can move the effective purchase price significantly from what the LOI states. These mechanics must be drafted with precision in the purchase agreement." — Alex Lubyansky, Esq., Acquisition Stars
This is why it's critical to analyze historical AR and AP trends during due diligence. If a seller manipulates the timing of AR or AP before the sale, the peg may look artificially favorable. Buyers who fail to catch these patterns might end up with unexpected financial burdens after the deal closes. To avoid disputes, it's important to define which AR and AP line items are included in the working capital calculation — ideally, this should be clarified in the Letter of Intent (LOI).
How AR and AP Affect Valuation and Lender Confidence
AR and AP trends also play a significant role in determining the valuation multiple and whether lenders will approve financing for the deal.
For example, aging receivables can reduce valuation multiples because they slow down cash conversion, which makes lenders uneasy. Additionally, if customer concentration is high — where one client accounts for 30% or more of revenue — it can lower the valuation multiple by 1.0 to 2.0 turns. If that concentration exceeds 40%, many lenders see it as a deal breaker.
On the AP side, lenders carefully evaluate payment behavior. A business with stretched payables or a rising DPO trend might appear to be masking cash flow problems. Clean and well-documented financial records not only support higher valuation multiples but are often a requirement for financing, especially with SBA loans. Most SBA 7(a) lenders require a Debt Service Coverage Ratio (DSCR) of at least 1.25x, and this calculation heavily depends on normalized AR and AP data.
| AR/AP Factor | Valuation Impact | Lender Sensitivity |
|---|---|---|
| Customer concentration >30% of AR | −1.0 to −2.0 turns on multiple | Very high — potential deal killer |
| Aging AR (>45–60 days) | Multiple compression | High — reduces DSCR |
| Stretched AP (rising DPO trend) | Peg adjustment required | High — signals cash flow strain |
| Clean, documented books | Supports top of range | Very high — required for SBA |
Understanding these factors is essential for structuring a deal that aligns valuation with lender expectations.
Building Cash Flow and Debt Service Projections
AR and AP trends don't just influence the deal structure — they also form the basis for post-close cash flow planning. Analyzing monthly historical DSO (Days Sales Outstanding) and DPO trends reveals the true timing of cash inflows and outflows. This is especially important for businesses with seasonal earnings, which might show strong annual profits but face tight liquidity during certain months. To mitigate this, it's recommended to have 60 to 90 days' worth of operating expenses available as working capital at closing.
"Many acquisition failures are simply undercapitalization failures. Lenders commonly want to see a realistic working capital plan, seasonality awareness, and post-close cash buffer." — BizTrader
Developing a detailed 12-month cash flow projection based on actual AR collection patterns and AP payment cycles — rather than relying on averages — provides a clearer picture of the business's ability to meet debt obligations from day one. If the numbers only work by cutting the owner's salary to below-market levels, most SBA lenders will decline the deal, viewing it as over-leveraged.
A Step-by-Step AR and AP Due Diligence Workflow
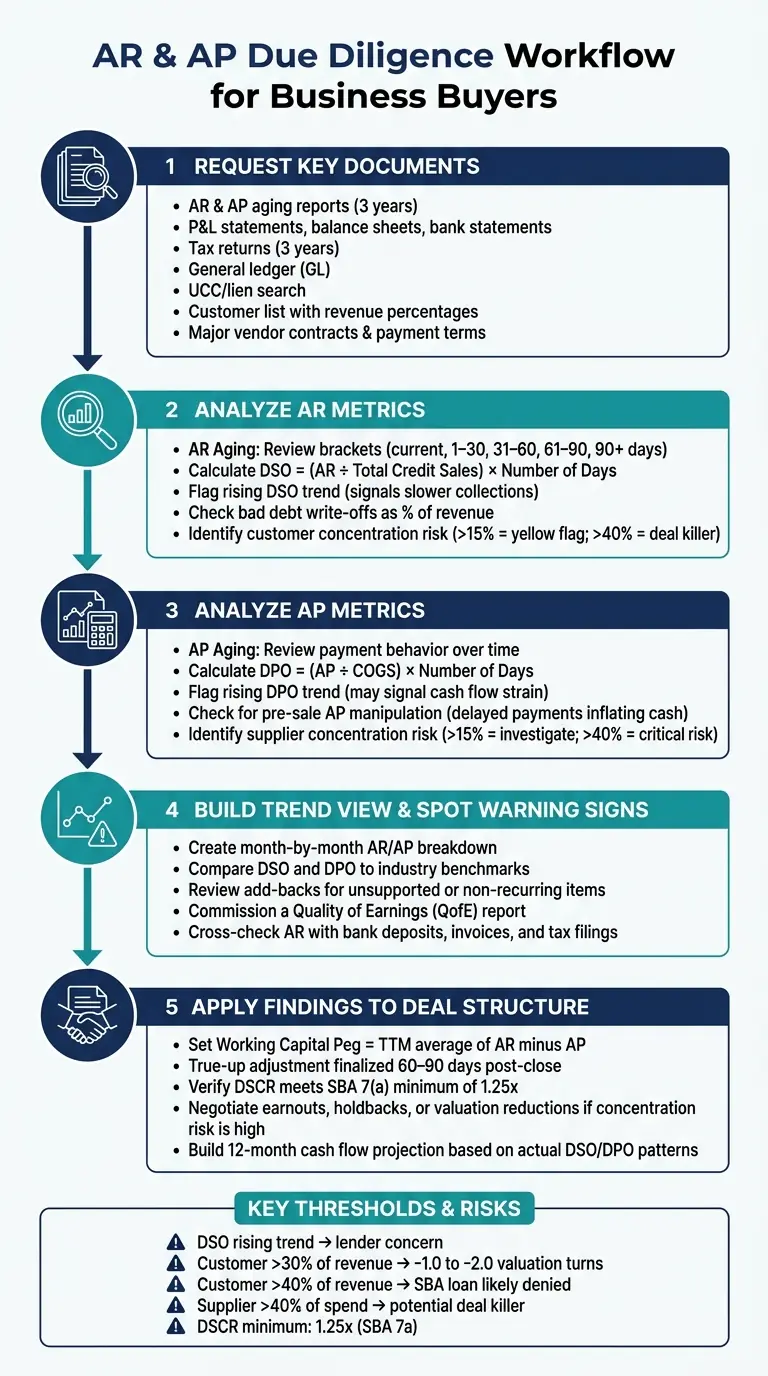
Understanding which metrics matter is just the beginning. The real challenge lies in creating a reliable process for collecting and analyzing data before making any commitments. Below is a structured approach to evaluating AR and AP trends.
Documents and Reports to Request from the Seller
The key to accurate AR and AP analysis starts with having the right documentation. To get a complete picture, request essential financial records such as AR and AP aging reports, profit and loss statements, balance sheets, bank statements, and at least three years of tax returns. Additionally, ask for the general ledger (GL) to trace transactions, an add-back schedule with evidence, and a UCC/lien search to identify any debts that must be resolved at closing.
For customer insights, request a list of customers, including revenue percentages from top clients and churn data. On the vendor side, obtain major vendor contracts and payment terms. These documents are critical for evaluating risks like over-reliance on key customers or vendors, as well as understanding whether relationships will endure after ownership changes.
"A smart move is a light QoE (Quality of Earnings) mindset even on small deals: tie revenue to bank deposits, invoices, and tax filings; tie payroll to payroll reports; tie COGS to vendor statements." — BizTrader
| Diligence Area | Documents to Request | What You're Verifying |
|---|---|---|
| Financial Performance | P&Ls, balance sheets, bank statements, tax returns, AR/AP aging | That revenue and margins are real and repeatable |
| Cash Flow Normalization | General ledger, detailed expense records, add-back schedule with proof | That SDE/EBITDA and add-backs are supported |
| Working Capital | Inventory reports, AR/AP trends, seasonality notes | That the business can operate post-close without panic |
| Liens & Debt | UCC/lien search, payoff letters | What must be paid off at closing |
| Customers | Customer lists, top customer revenue percentages, churn data | That revenue isn't overly dependent on a single customer |
| Contracts | Major customer/vendor contracts | Legal transferability and change-of-control clauses |
Once you've gathered all the necessary documents, the next step is to dive into the data and uncover any trends or warning signs.
Building a Trend View and Identifying Key Warning Signs
Creating a month-by-month breakdown of AR and AP metrics is crucial for spotting trends that a one-time snapshot might miss.
Compare the current AR aging and DPO trends to benchmarks discussed earlier to flag any discrepancies that need further examination. Pay special attention to add-backs — if they include revenue from lost clients or unearned "pipeline" revenue, it could signal deeper issues. These are the types of problems that a Quality of Earnings review typically uncovers.
Customer concentration is another area to monitor closely. If a single client accounts for more than 15% of revenue, many buyers start to adjust for risk. When that figure climbs to 25%–30%, buyers often negotiate valuation reductions, earnouts, or cash holdbacks to mitigate potential exposure.
"A Quality of Earnings analysis is not a rubber stamp on the seller's stated earnings; it is a structured examination of whether those earnings are real, sustainable, and fairly presented." — Alex Lubyansky, Esq., Acquisition Stars
Using Clearly Acquired's Tools to Speed Up Analysis

Manually analyzing trends using aging reports and GL exports can be slow and prone to mistakes. Clearly Acquired simplifies this process by enabling buyers to sync directly with QuickBooks Online for real-time financial insights or upload financial records for AI-driven reviews.
Clearly Acquired's Clara AI automates financial modeling, highlights irregularities in aging patterns, and provides a Business Health Score covering financial and operational aspects. This helps buyers evaluate more deals in less time and approach due diligence with a clear, data-backed understanding of potential risks — making for smarter decision-making throughout the acquisition process.
Conclusion: Putting AR and AP Analysis to Work in Your Next Deal
Accounts Receivable (AR) and Accounts Payable (AP) trends go far beyond basic accounting — they uncover operational hurdles that a single balance sheet snapshot might hide. These trends can highlight issues like delayed collections, extended vendor payment terms, or over-reliance on a single customer.
Adjustments to working capital can significantly affect the purchase price — sometimes by hundreds of thousands of dollars — from the Letter of Intent (LOI) stage onward. On the financing side, SBA lenders require a minimum Debt Service Coverage Ratio (DSCR) of 1.25x. This ratio heavily depends on the consistency and reliability of AR cash flows. If collections are erratic or AP is excessively stretched, even a seemingly profitable business might fail to meet this requirement.
"The more predictable and diversified future cash flows are, the higher the valuation multiple." — Lockwood & Associates Inc.
Customer concentration is another critical factor where trends speak louder than isolated data points. If a single customer accounts for more than 15%–30% of revenue, buyers often insist on earnouts, holdbacks, or even valuation reductions to safeguard against the risk of losing that client post-acquisition. These measures aren't penalties — they're practical strategies rooted in data to protect the deal's integrity and value.
To simplify this process, Clearly Acquired offers tools that make evaluating these details easier. Their Clara AI platform automates financial modeling, flags concentration risks, and identifies anomalies in AR and AP aging patterns. This allows buyers to assess more opportunities without compromising on thoroughness. With a network of over 500 lending partners and a dedicated advisory team guiding deals from LOI to close, Clearly Acquired bridges the gap between financial insights and actionable deal structures.
FAQs
What AR aging changes signal a deal red flag?
Changes in accounts receivable aging can reveal potential issues, especially if they point to declining collection efficiency or unstable cash flow. Watch for key warning signs like:
- A rise in overdue or uncollectible invoices
- Declining profit margins
- Heavy reliance on a small group of customers (customer concentration risks)
To help buyers spot these risks early, Clearly Acquired leverages AI-powered tools. These tools dig into the data, making it easier to uncover potential problems and move forward with greater confidence during due diligence.
How do I set a fair working capital peg?
To determine a fair working capital peg, start by establishing a baseline for the net working capital required for the business to operate smoothly. Since adjustments to working capital can heavily influence the final purchase price, it's essential to outline a clear framework for these adjustments in your Letter of Intent (LOI). Reviewing historical monthly trends is key — this helps you spot seasonal patterns and understand the business's operational needs. With this analysis, you can set a peg that's well-supported and ensures stability in the capital structure after the acquisition.
What AR/AP issues can kill SBA financing?
SBA financing hinges on a business demonstrating clear, verifiable, and consistent cash flow. Problems such as incomplete or messy records, lack of transparency, or dependence on informal verbal agreements can pose serious challenges during the underwriting process. Similarly, businesses that rely heavily on cash sales without proper documentation or show inconsistent bookkeeping practices may struggle to convince lenders of their financial stability, which is essential for securing acquisition debt.
Find the right lender for your business
Whether it's working capital, an SBA loan, or acquisition financing — we'll match you with the right capital partner.
About the author
Principal & CEO/CIO
Samson Jagoras has 15+ years across finance, real estate, and business acquisitions. He began his career as a Futures & Commodities broker and later served as Chief Strategy Officer of an INC 500 marketing and technology firm, helping scale revenue from $1M to over $100M. Today he buys, builds, and advises a portfolio of companies with a focus on M&A, capital allocation, and operational strategy.