QA Metrics: Measure, Fix, Improve
Track 3–5 QA KPIs across defects, flow, and cost—then use a four-step review loop to diagnose, fix, and verify quality improvements.
 Samson JagorasPrincipal & CEO/CIOJuly 18, 2026

Sell your business for maximum value
Our sell-side advisors package, market, and negotiate your exit to qualified, verified buyers — confidentially.
If I want quality to improve, I need to track a small set of numbers that show where work fails, how long fixes take, and what those failures cost.
At the simplest level, QA metrics help me answer three questions:
- What is breaking?
- How fast am I fixing it?
- Is it hurting customers or margin?
This article boils QA metrics into six groups:
- Defect metrics: defect density, DPMO, detection rate, escape rate, and production defects
- Flow metrics: cycle time, resolution time, and first-pass yield
- Check and rework metrics: test coverage, rework rate, and ticket reopen rate
- Customer issue metrics: complaint rate, returns, warranty claims, and credits
- Service reliability metrics: uptime, availability, and session success
- Cost metrics: prevention, appraisal, rework, refunds, penalties, and other cost of quality items
A simple way I think about it:
- If defect escape rate goes up, more problems are reaching customers.
- If first-pass yield drops, more work is being redone.
- If cycle time and resolution time stretch out, teams are getting stuck.
- If complaints, refunds, or warranty claims climb, the problem is no longer internal.
- If uptime slips from 99.9% to 99.5%, that small percentage change can mean a lot more failed sessions.
- If failure costs keep growing, margin starts to shrink.
The article also makes one point that matters most: metrics do not fix anything by themselves. I need a review loop that does four things every time:
- Track the KPI
- Diagnose the root cause
- Change the process, training, or system
- Verify that the same metric improved
In short, the best QA setup is not a giant dashboard. It is 3 to 5 KPIs, clear owners, alert thresholds, and trend reviews tied to action.
That is the full idea of the article in plain English: measure failures early, rank them by business cost, fix the cause, and check that the fix holds.
Driving Quality Through Metrics, Advocacy, and Continuous Improvement w/Kat Obring

Defect Metrics: Finding Where Quality Breaks Down
Defect metrics show where quality fails and which fixes will improve the process fastest. They help you see where problems start, how many get through, and where to step in first. From there, it helps to split defects into two groups: the ones caught inside the business and the ones that make it to customers.
Defect Density, DPMO, and Defect Detection Rate
Defect density tracks how many defects show up per unit of output, whether that output is invoices, onboarding files, or production volume. If defect density starts climbing in one part of a process, that's a plain sign that something in that workflow has gone off track.
DPMO (defects per million opportunities) adjusts the metric for high-volume work. That makes it useful when you want to compare quality across different process types or different team sizes, because it looks at the total number of chances for a defect to happen.
Defect detection rate measures the share of defects your internal checks catch before they hit a customer or a downstream process. A high rate tells you those checks are doing their job. A low rate means defects are getting through, and the first signal may be a customer complaint.
Defect Escape Rate and Production Defects
Defect escape rate is the percentage of defects that pass QA and reach customers. Production defects are the failures that show up in live operations. Those are usually the most expensive ones because the damage has already been done.
A July 2026 Telstra outage shows what escaped defects can cost: missed firmware updates led to major service disruption and compensation claims.
Silent failures are the toughest ones to spot because they slip past standard checks. If you only track visible failures, you'll miss defects that never appear in routine monitoring.
Using Defect Metrics to Prioritize Fixes
Once you measure defects, the next job is to rank them by impact. Break them out by origin, severity, and business cost.
For a small business, invoicing errors, onboarding mistakes, and inventory discrepancies shouldn't be treated the same way. They come from different causes, create different costs, and need different fixes. Lump them together, and you waste time while the most important problems stay buried.
A simple way to sort priorities is to look at:
- where the defect starts
- how far it spreads
- how much time or revenue it consumes
Start with the defects that hit the most downstream steps. That helps cut follow-on defects faster and keeps rework from piling up.
Next, flow metrics show how fast teams clear those defects and reduce rework.
Efficiency and Flow Metrics: Reducing Delays, Rework, and Waste
Flow metrics show where work slows down, loops back, or gets stuck. They point to the friction that leads to delays, rework, and waste. After you spot defects, the next step is simple: how fast does the process clear them?
Cycle Time, Resolution Time, and First-Pass Yield
Cycle time measures the total time from start to finish. Resolution time measures how long it takes to fix a known issue. Put together, these metrics show where the process drags, whether that's in approvals, handoffs, or reviews that stretch longer than they should.
Long resolution times let known issues sit around. That often leads to more rework and more operational risk.
First-pass yield (FPY) is the percentage of work finished correctly the first time, with no rework needed. When FPY is low, it's a clear sign that something earlier in the process needs work. If invoices keep coming back for corrections before they're sent, the issue usually starts where the error was made, not where someone fixes it later.
Test Coverage, Rework Rate, and Ticket Reopen Rate
Test coverage shows how much of your process or system is being checked. Rework rate tracks the share of finished work that must be done again. Ticket reopen rate measures how often a closed issue gets flagged again, which usually means the first fix didn't go deep enough.
Low coverage creates blind spots. Blind spots lead to rework. Weak fixes lead to reopened tickets.
What Good Flow Metrics Look Like in Business Operations
In business operations, flow metrics show up in everyday work. You see them in how long reviews take, how often documents need correction, how clean each handoff is, and how many fixes show up after a process was supposed to be done.
- Shorter cycle times mean teams can move faster with more confidence.
- Fewer corrections mean less back-and-forth between stakeholders.
- A lower post-completion fix rate suggests the QA work done early caught issues before they spread.
These process signals lead into the business-impact metrics that come next.
Get a Quality of Earnings analysis you can trust
Business Impact Metrics: Linking QA Performance to Customer and Financial Results
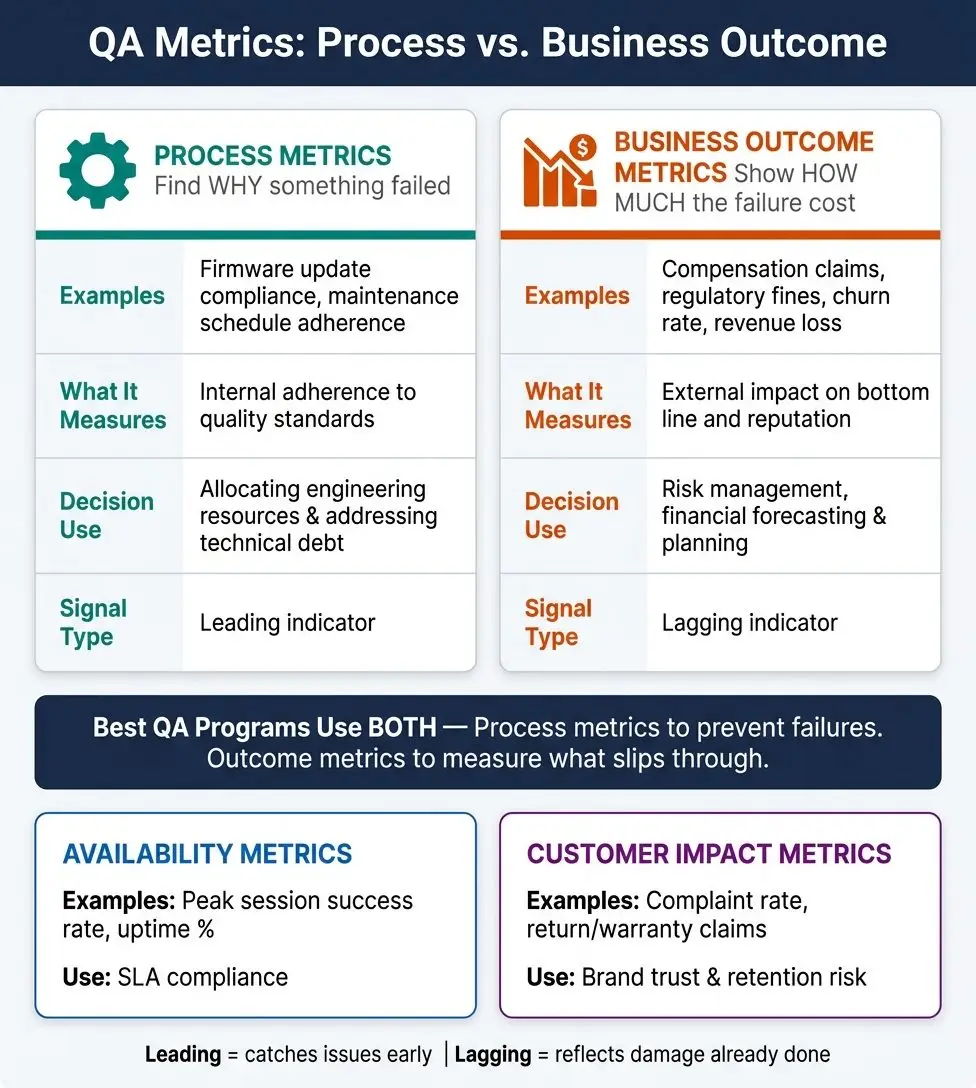
After flow metrics, the next step is simple: figure out whether quality issues are reaching customers and cutting into margin. Unresolved defects and rework rarely stay behind the scenes. They show up as complaints, refunds, and direct financial risk. Process metrics tell you how work is going inside the business. Business impact metrics show what those failures cost in money, trust, and reputation.
Customer Satisfaction, Complaint Rate, and Return or Warranty Signals
Customer satisfaction, complaint rates, and return or warranty claims are often the clearest signs that internal quality issues made it all the way to the customer. When these numbers go up, the process problem has already escaped your controls.
Complaint rate tracks how often customers formally report a problem. Return and warranty claim rates show how often a product or service failed after delivery. Put together, they show the cost of weak processes in plain terms: refunds, replacement costs, and lost repeat business.
These are lagging signals. By the time they move, the damage is already out in the open. That's why many teams pair internal dashboards with public outage reports. It helps them spot quality failures sooner instead of waiting for internal alerts alone to catch up.
Uptime, Availability, and Cost of Quality
Uptime and availability show how reliably a service or system works for the end user. For service businesses, availability should mean more than a system being technically online. What matters is whether customers can complete a session or transaction without trouble.
Cost of quality (CoQ) shows the full financial picture. It includes what you spend on prevention, appraisal, and failure:
- Prevention: training, audits, and maintenance
- Appraisal: testing and inspections
- Failure: rework, refunds, and penalties
Failure costs tend to grow the fastest. A small issue can turn into major financial exposure when prevention breaks down.
Process Metrics vs. Business Outcome Metrics
This split matters because each metric type supports a different kind of decision. Process metrics help you find why something failed. Business outcome metrics show how much that failure cost.
The main difference comes down to this: does the metric point to root cause, or does it show external damage?
| Metric Type | Examples | What It Measures | Decision-Making Use |
|---|---|---|---|
| Process Metrics | Firmware update compliance, maintenance schedule adherence | Internal adherence to quality standards | Allocating engineering resources and addressing technical debt |
| Business Outcome Metrics | Compensation claims, regulatory fines, churn rate, revenue loss | External impact on the company's bottom line and reputation | Risk management, financial forecasting, and planning |
| Availability Metrics | Peak session success rate, uptime percentage | Whether users can complete tasks successfully | Checking SLA compliance |
| Customer Impact Metrics | Complaint rate, return or warranty claims | Customer-facing impact of failures | Assessing brand trust and long-term customer retention risk |
If you track only process metrics, you get an inside view but miss the customer hit. If you track only outcome metrics, you're stuck reacting after the damage is done. The best QA programs use both: process metrics to prevent failures, and outcome metrics to measure what still slips through. Those two views feed the review loop that follows.
How to Build a QA Measurement and Review Loop
Once you know which metrics matter, the next step is to build a review loop that turns numbers into action. Defect, flow, and business-impact metrics don't do much on their own. They only start to matter when they lead to a response. If you track them without a set review process, you're just reporting. That's the difference between watching quality and improving it.
Choose Metrics, Set Baselines, and Define Targets
Start with 3–5 KPIs tied to your highest-risk failure points. Before you set targets, document current performance so you have a clear baseline.
Each metric also needs an owner. If no one is accountable, review meetings tend to produce plenty of talk and not much action. Assign a specific person or team to each KPI, and make sure they have the authority to respond when a number starts moving the wrong way.
Set threshold-based alerts alongside your targets. A monthly review is too slow if a problem starts snowballing mid-cycle. Automated alerts for threshold breaches and spikes in outside complaints can give leadership an early warning before a small issue turns into a bigger one.
Review Trends, Test Changes, and Remeasure Results
A single data point tells you almost nothing. Trend lines matter. Internal dashboards should be checked against outside signals so the numbers reflect the customer experience, not just what your internal system happens to record.
Review metrics on a steady cadence. When a trend starts slipping, look at technical, process, and people-related causes before choosing a fix. Root-cause review needs to examine all three — not just the symptom sitting on the surface.
After you make a change, measure again against the same baseline. If the number doesn't move, the fix didn't work — or you solved the wrong problem.
Conclusion: The QA Metrics That Actually Drive Improvement
Defect metrics show where quality breaks. Flow metrics show where work slows down or gets repeated. Business impact metrics show what those failures cost in dollars and customer trust. But none of that matters without a review loop that pushes people to act.
Use the same four-step sequence in every review cycle.
| Step | Action | What to Look For |
|---|---|---|
| Track | Monitor your chosen KPIs and outside signals | Deviations from target, early threshold alerts |
| Diagnose | Investigate root cause — technical, process, and people | Why the failure happened, not just that it happened |
| Change | Implement a specific, targeted fix | Process update, training, system fix, or maintenance update |
| Verify | Check the same metric after the change | Did the trend actually improve? |
Continuous improvement comes from a small set of metrics, reviewed on schedule, with changes tested and verified.
FAQs
How do I choose the right 3 to 5 QA KPIs?
Choose 3 to 5 QA KPIs that match your quality goals and the parts of the business you want to improve. Keep your focus on metrics that are clear, measurable, and easy to track over time.
The best KPIs help you improve step by step. They make it easier to spot problems, measure results, and make better decisions based on what the data shows.
Which QA metrics should I track first?
Start with QA metrics that show quality, consistency, and progress over time as clearly as possible. Put your attention on the numbers that tie most closely to your business processes and improvement goals.
It helps to begin small. Pick a short list of metrics you can track the same way every time, then adjust that set as you learn which ones give you the clearest view of what's working and what needs attention.
How often should QA metrics be reviewed?
Review frequency depends on the metric and the pace of the business. A useful default:
- Daily or weekly for active operational metrics like defect counts, test pass rates, blocked tests, and build failures
- Biweekly or monthly for trend-based metrics like defect leakage, test case effectiveness, and automation coverage
- Quarterly for higher-level QA performance reviews tied to team goals, process changes, and product quality trends
The right cadence depends on the team, release speed, and product risk. A fast-moving team with frequent deployments may need weekly reviews. A slower release cycle may be fine with monthly reviews for most metrics.
The key idea is simple: review QA metrics often enough to spot issues early, but not so often that the team gets buried in numbers instead of acting on them.
Sell with advisors who maximize your outcome
From valuation and positioning to closing the deal, we run a competitive process to get you the best terms.
About the author
Principal & CEO/CIO
Samson Jagoras has 15+ years across finance, real estate, and business acquisitions. He began his career as a Futures & Commodities broker and later served as Chief Strategy Officer of an INC 500 marketing and technology firm, helping scale revenue from $1M to over $100M. Today he buys, builds, and advises a portfolio of companies with a focus on M&A, capital allocation, and operational strategy.